
Fetching metrics in Xen: why the method matters
Measuring something will always affect the system we are measuring. This is a kind of universal rule, and fetching metrics from Xen is no exception. Indeed, the simple act of fetching metrics will always slightly modify Xen's behavior. However, we can reduce such interference. This post introduces a new mechanism that we are developing at Vates to reduce the overhead in Xen when fetching metrics.
Xen Metrics 101
To know how well a VM (guest) performs, we can get domain metrics like "how much time vCPUs spend idle or running", "how much memory is consumed", the "number of tlb flushes", and so on. Metrics are usually obtained by relying on applications such as xcp-rrdd that periodically sample Xen's counters. Counters like performance counters, vCPU info, domain info, etc. Xcp-rrdd collects these counters and stores them in a way that can be easily accessed. Counters allow sysadmins to spot software issues in the VM. For example, high vCPU consumption may indicate that the wrong algorithm is used or a high memory consumption may indicate a leak in an application within that VM.
In Xen, the way statistics are collected is as follows:
1. xcp-rrd queries the xapi, which uses xc to issue a hypercall to get the counters.
2. Xen traps that hypercall, processes it, and returns to the guest.
3. Depending on the type of counter, the hypercall that is used may vary. Some of the counters are based on the sysctl interface and others are based on the domctl interface. Different hypercalls mean that different spin-locks are held during the execution of that hypercall.
What happens when applications like xcp-rrd often sample those counters? This competes with other operations that hold on the same spin-lock thus degrading the whole system performance. In other words, we affect the system that we are measuring. Can we do better? Yes! And this is exactly where Acquire Resource is important.
Acquire Resource
Acquire resource is a mechanism that allows sharing a domain’s resources with a PV tool. When we say PV tools, we refer to user-applications running in Dom0 that are meant to interact with Xen, e.g. xenperf at xen/tools/misc. The resource always has some pages that are associated with a domain. This interface allows sharing of these pages between Xen and the PV tool: when a resource is requested, Xen maps those pages in the PV tool memory address.
For example, this is the mechanism used to share the traces that are generated by the Intel Processor Trace for a given domain (see here). When enabled, these traces contain information about the execution of the vCPU to be analyzed afterward. Traces are stored in buffers that are mapped into the PV tool memory address. In this case, the PV tool is named xen-vmtrace and you can find it at xen/tools/misc/xen-vmtrace. By doing this, the PV tool does not have to issue any hypercall to copy those buffers. It simply accesses them by reading a chunk of shared memory.

Current status
At Vates, we are currently working on a proof-of-concept in which the querying of vCPU statistics is based on acquire resource. Instead of querying the counters by issuing a hypercall, we propose a new resource that a PV tool can request to map the counters in its memory address and then access them when required. We are currently focused on per-vCPU statistics like the time that the vCPU has spent in the running state. However, we are investigating how to extend this mechanism to per-domain counters like consumed memory and much more. This will lead to reducing the number of hypercalls, and will leave more resources for what truly matters: running your VMs with the highest performance level.
We have already submitted an RFC to the Xen mailing list in order to get feedback. I personally look forward to presenting this at the next Xen Summit!
Future developments
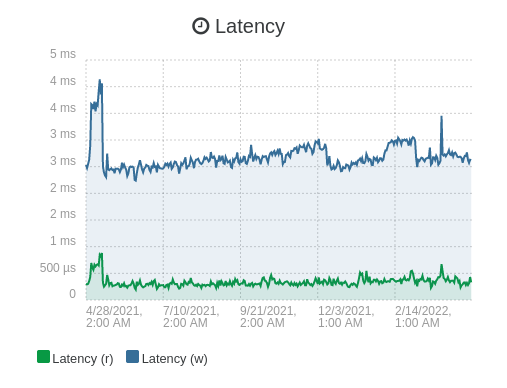
Obviously, this is just a start. We also explored the "Xen part" of fetching metrics in a more efficient fashion. But beyond that, we'll also have the opportunity to think about how to expose those metrics. Right now, after metrics enter into the xcp-rrdd program, they are stored in a kind of RRD format, which you must then request from XAPI. This is what's done in Xen Orchestra when you display the statistics of your VM for example:
However, XAPI is sending it in XML, which is very costly in terms of CPU to parse. Also, this is not a standard format. That's why we'd like to get those metrics directly fetched from Xen in an Open Metrics format. This will allow a very neat way to store them directly in compatible metrics databases, like Prometheus for example.