VM Failing to Reboot
-
@kagbasi-ngc There's no slash in
debugwhile using the/setcommand:
Also please don't enable debugging for bootmgr, just do it on
{default} -
@dinhngtu said in VM Failing to Reboot:
@kagbasi-ngc There's no slash in
debugwhile using the/setcommand:I had already tried that, but I think I did it on {bootmgr} - so I'll retry on {default} when I get back in the lab.
Update as of 09:58AM EDT:
I tried the command against the {default} identifier, and it worked. However, I didn't see any change in behavior during the boot process. Should I continue with the instructions for exposing the VMs serial console? -
@dinhngtu said in VM Failing to Reboot:
Also, one way to verify the issue is to install MediaEnable on another VM.
So, I built a new VM from the same template, renamed it and joined it to the domain (both actions required a reboot which was initiated from inside the OS). I then placed it in the correct OU and rebooted so it will grab the correct GPOs (this reboot action was also initiated from inside the OS). Finally, I installed MailEnable and when it finished I initiated a final reboot from inside the OS.
None of the reboots caused the OS to fail to boot, and it was built from the same template (which has the Citrix Guest Tools v9.4 installed). Below is a link to a video I took of the test.
-
@kagbasi-ngc said in VM Failing to Reboot:
I tried the command against the {default} identifier, and it worked. However, I didn't see any change in behavior during the boot process. Should I continue with the instructions for exposing the VMs serial console?
Yes, it won't show anything special on screen during boot, but attaching a debugger should work if everything is configured correctly. Note that it's timing dependent (there's a small time window where you can attach before it reaches the BSOD) so it might take a few tries.
-
@dinhngtu Roger that, I'll try it now and see what happens.
-
@dinhngtu While following the instructions you shared on how to expose the VM's serial console, I'm having trouble with this command "
bcdedit /dbgsettings serial debugport:1 baudrate:115200". I had to modify it slightly to specify the/storeparameter (as indicated previously).Since I don't have the ability to run this command inside the OS, I am running it from a command shell that I accessed via the Troubleshooting menu (from an installation disk). It accepted the first command "
bcdedit /store S:\EFI\Microsoft\Boot\BCD /set {default} debug on" but won't accept "bcdedit /store S:\EFI\Microsoft\Boot\BCD /set {default} dbgsettings serial debugport:1 baudrate:115200". It throws the following error:The element data type specified is not recognized or does not apply to the specified entry.What am I missing here?
Second issue - I attempted to get the host ready by setting the parameters (as per the instructions) and opened the firewall port (I used 7001). However, when I attempt to connect to the host via SSH on tcp\7001, the connection is refused.
-
@kagbasi-ngc You'll need these commands instead:
bcdedit /store bcd /set {dbgsettings} debugtype serial
bcdedit /store bcd /set {dbgsettings} debugport 1
bcdedit /store bcd /set {dbgsettings} baudrate 115200
The serial port is only accessible when the VM is running.
-
@dinhngtu Thank you for breaking it down, this worked and I was able to get the commands to be accepted on the VM. Whether they actually took effect, I can't tell.
Here's what I observed:
-
I prepped the host with the
xe vm-param-set uuid=<uuid> platform:hvm_serial=tcp::<port>,server,nodelay,nowaitcommand and opened the firewall (using tcp port 7001). -
I disabled Secure Boot on the VM, prepped a PuTTY session to connect to my host on TCP port 7001
-
I noticed that whenever the VM starts booting, and I simultaneously initiate the putting session, it seems like a connection is made but no data is returned to the screen. The session terminates as soon as the VM runs into the BSOD and shuts down.
I recorded a video of it: https://photos.app.goo.gl/wzJSwfoJJJWwtGk57
Next thing with Windbg. This is my first time using it, so please pardon my ignorance. However, I am unable to attach to the kernel debug, as per the instructions you provided. I see a
Kernel Debugmenu item and when I click on it, I don't see any place where I can enter the connection string specified in the instructions you provided.Here's another video capture: https://photos.app.goo.gl/ZnjVQjo5Hk589dQ96
We're making progress, and I really appreciate your patience, thank you.
-
-
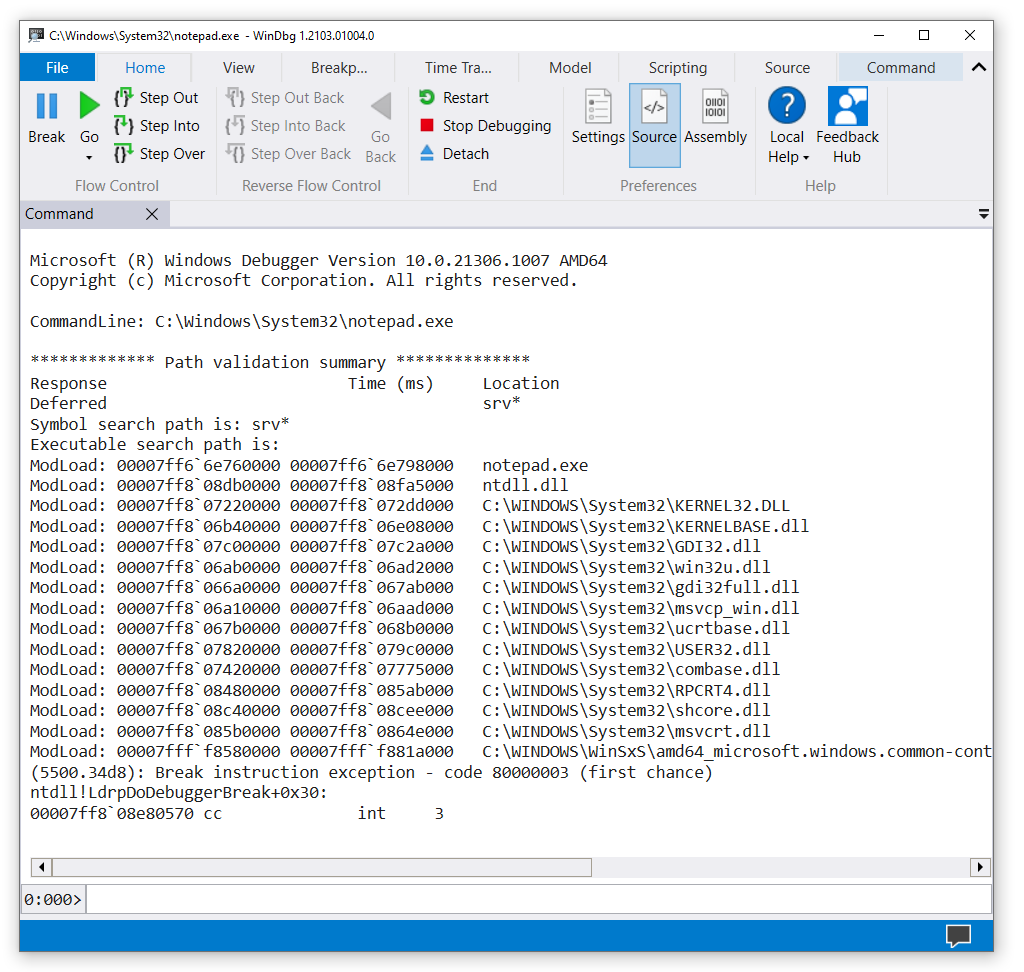
@kagbasi-ngc That's the old WinDbg. You should use the new WinDbg instead: https://learn.microsoft.com/en-us/windows-hardware/drivers/debugger/
The serial connection looks to be working.
-
@kagbasi-ngc More instructions for you on how to use WinDbg:
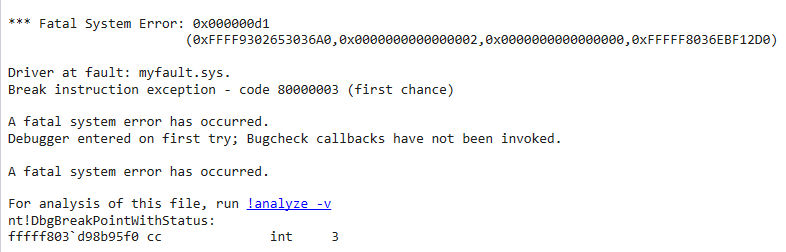
In WinDbg, select File - Attach to kernel - Paste connection string and paste in your connection string. Once the debugger finishes attaching, click Go until WinDbg says "BUSY Debuggee is running", then wait until the VM crashes. You should see an error message (see screenshot).
Click the "!analyze -v" link, it will spit out a bunch of analysis info. This will take a while. Once it's done, paste the entire WinDbg output counting from the initial "Fatal System Error" message, including the entirety of the analysis output.
-
@dinhngtu Thanks for the instructions. I'm back in the lab now, and I'm going to try as you've suggested.
Because the lab is airgapped (disconnected from the Internet), I wasn't able to install the latest version of Windbg, which is why I opted to use the version from the Windows SDK ISO. I need to figure out how to get the latest Windbg installed in an offline system, then I'll be able to proceed.
-
@kagbasi-ngc Try this method: https://xcp-ng.org/forum/post/85097
-
@dinhngtu Thanks, that helped. Download has started, once it completes, I'll get it installed and retry.
I'd also found this - https://gist.github.com/alexrintt/9502728c6d75d27e2885c9cdaab0e550
-
@dinhngtu Thanks for your guidance, I was able to get the new version of Windbg installed and successfully made a connection to the VM. Below is the output that was captured.
I did notice that while the debugger was connected and running, the VM would not BSOD or proceed any further than the splash screen (picture below). I left it running and will go check on it after I get out of my meeting, and report back.
Windbg Output:
************* Preparing the environment for Debugger Extensions Gallery repositories ************** ExtensionRepository : Implicit UseExperimentalFeatureForNugetShare : true AllowNugetExeUpdate : true NonInteractiveNuget : true AllowNugetMSCredentialProviderInstall : true AllowParallelInitializationOfLocalRepositories : true EnableRedirectToChakraJsProvider : false -- Configuring repositories ----> Repository : LocalInstalled, Enabled: true ----> Repository : UserExtensions, Enabled: true >>>>>>>>>>>>> Preparing the environment for Debugger Extensions Gallery repositories completed, duration 0.000 seconds ************* Waiting for Debugger Extensions Gallery to Initialize ************** >>>>>>>>>>>>> Waiting for Debugger Extensions Gallery to Initialize completed, duration 0.031 seconds ----> Repository : UserExtensions, Enabled: true, Packages count: 0 ----> Repository : LocalInstalled, Enabled: true, Packages count: 42 Microsoft (R) Windows Debugger Version 10.0.27725.1000 AMD64 Copyright (c) Microsoft Corporation. All rights reserved. Opened 10.0.10.12 Waiting to reconnect... Connected to Windows 10 20348 x64 target at (Wed Jan 22 09:28:50.709 2025 (UTC - 5:00)), ptr64 TRUE Kernel Debugger connection established. Symbol search path is: srv* Executable search path is: Windows 10 Kernel Version 20348 MP (1 procs) Free x64 Edition build lab: 20348.859.amd64fre.fe_release_svc_prod2.220707-1832 Kernel base = 0xfffff806`0b600000 PsLoadedModuleList = 0xfffff806`0c233d20 System Uptime: 0 days 0:00:00.000 Unable to load image ntkrnlmp.exe, Win32 error 0n2 KDTARGET: Refreshing KD connection *** Fatal System Error: 0x0000007b (0xFFFF8005512071F8,0xFFFFFFFFC0000034,0x0000000000000000,0x0000000000000001) Break instruction exception - code 80000003 (first chance) A fatal system error has occurred. Debugger entered on first try; Bugcheck callbacks have not been invoked. A fatal system error has occurred. For analysis of this file, run !analyze -v nt!DbgBreakPointWithStatus: fffff806`0ba29560 cc int 3 -
@kagbasi-ngc That's pretty odd, you're still getting
INACCESSIBLE_BOOT_DEVICE. Did XenBootFix finish successfully? If!analyze -vruns for too long, interrupt it with Ctrl+Break then runkb; !devnode 0 1 -
@dinhngtu Wait, was I supposed to run
!analyze -v? I simply kicked of the debugger and just let things be.Yes,
XenBootFix.exeran successfully and displayed a list of all the device drivers it disabled, however, since I haven't been able to get into the OS I haven't been able to run the Cleanup script. -
@dinhngtu I went back and clicked on
!analyze -vwithin the debugger and it spit out the following (log attached below). Please pardon me, as I'm not a developer and have never used this tool before, so didn't realize the boot process had actually been paused, awaiting my input from the debugger.Also, based on the output looks like my WinDbg setup isn't complete. Something about missing symbols. Googling how to get that setup now....
PS. The VM is still sitting at the splash screen (showing the Windows logo).
The contents of the debugger output exceeds the character limitation of this post, so I attached the file instead.
-
@kagbasi-ngc The symbols require an Internet connection on your WinDbg machine.
@kagbasi-ngc said in VM Failing to Reboot:
PS. The VM is still sitting at the splash screen (showing the Windows logo).
It's normal when kernel debugging with WinDbg. You can resume the VM by clicking Go.
Nevertheless, XenBootFix should have gotten rid of
INACCESSIBLE_BOOT_DEVICE. If it's not sensitive, can you send me the output of!devnode 0 1and the contents of your Registry atC:\Windows\System32\config\SYSTEM? -
@dinhngtu Of course, I can do that. I will be heading to back to the lab in about an hour.
I'm currently at home trying to figure out how to cache the symbols on another computer with Internet access and then transfer them to the offline PC where WinDbg is running at.
-
@kagbasi-ngc Normally you can't cache them, since the symbols depend on your exact Windows and updates version. The analysis output shouldn't be too important for
INACCESSIBLE_BOOT_DEVICE.
Hello! It looks like you're interested in this conversation, but you don't have an account yet.
Getting fed up of having to scroll through the same posts each visit? When you register for an account, you'll always come back to exactly where you were before, and choose to be notified of new replies (either via email, or push notification). You'll also be able to save bookmarks and upvote posts to show your appreciation to other community members.
With your input, this post could be even better 💗
Register Login