Openmetrics powered Grafana dashboards for Xen Orchestra
-
Hey everyone,
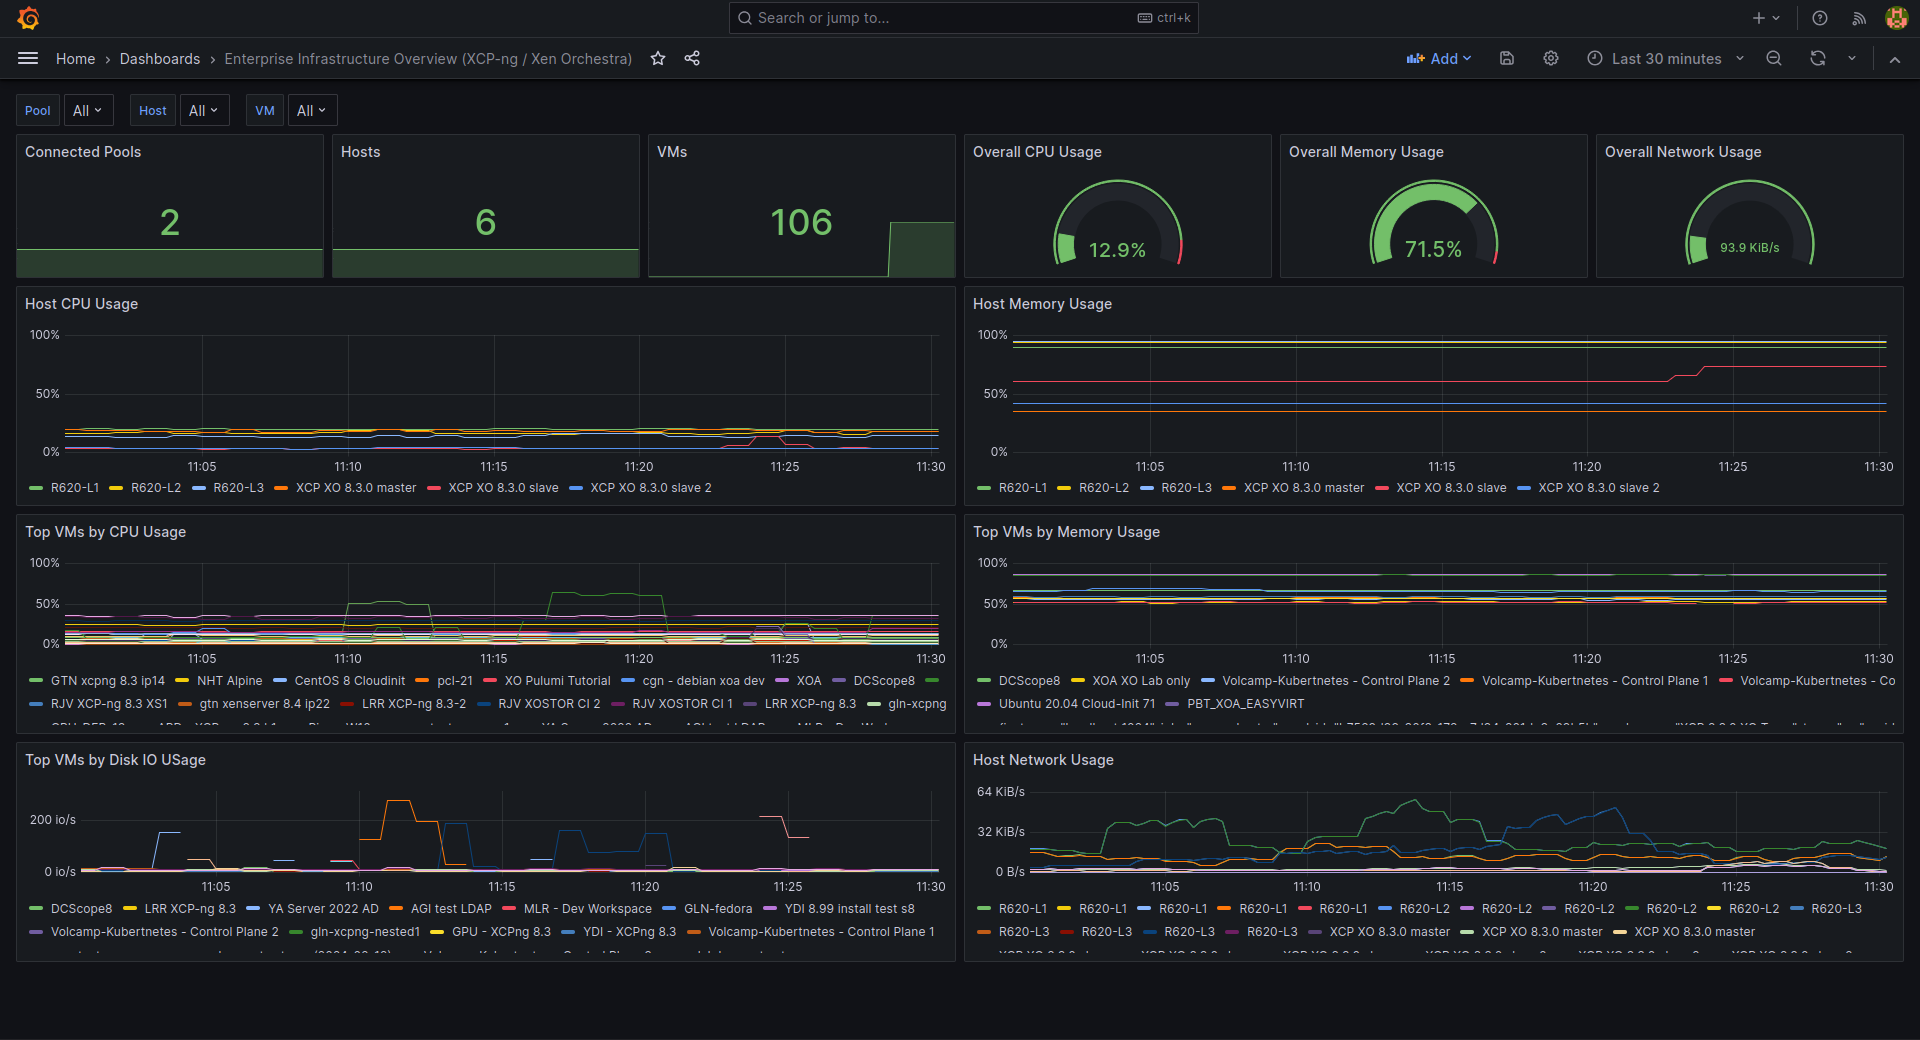
I'm creating this topic to showcase what's possible with the new Openmetrics data exports in Xen Orchestra using Prometheus and Grafana to build dashboards and monitoring tools.
Here is the json used for this demo dashboard: JSON
All the available metrics are described in https://docs.xen-orchestra.com/advanced
Here are a few other examples and JSONs from our community:
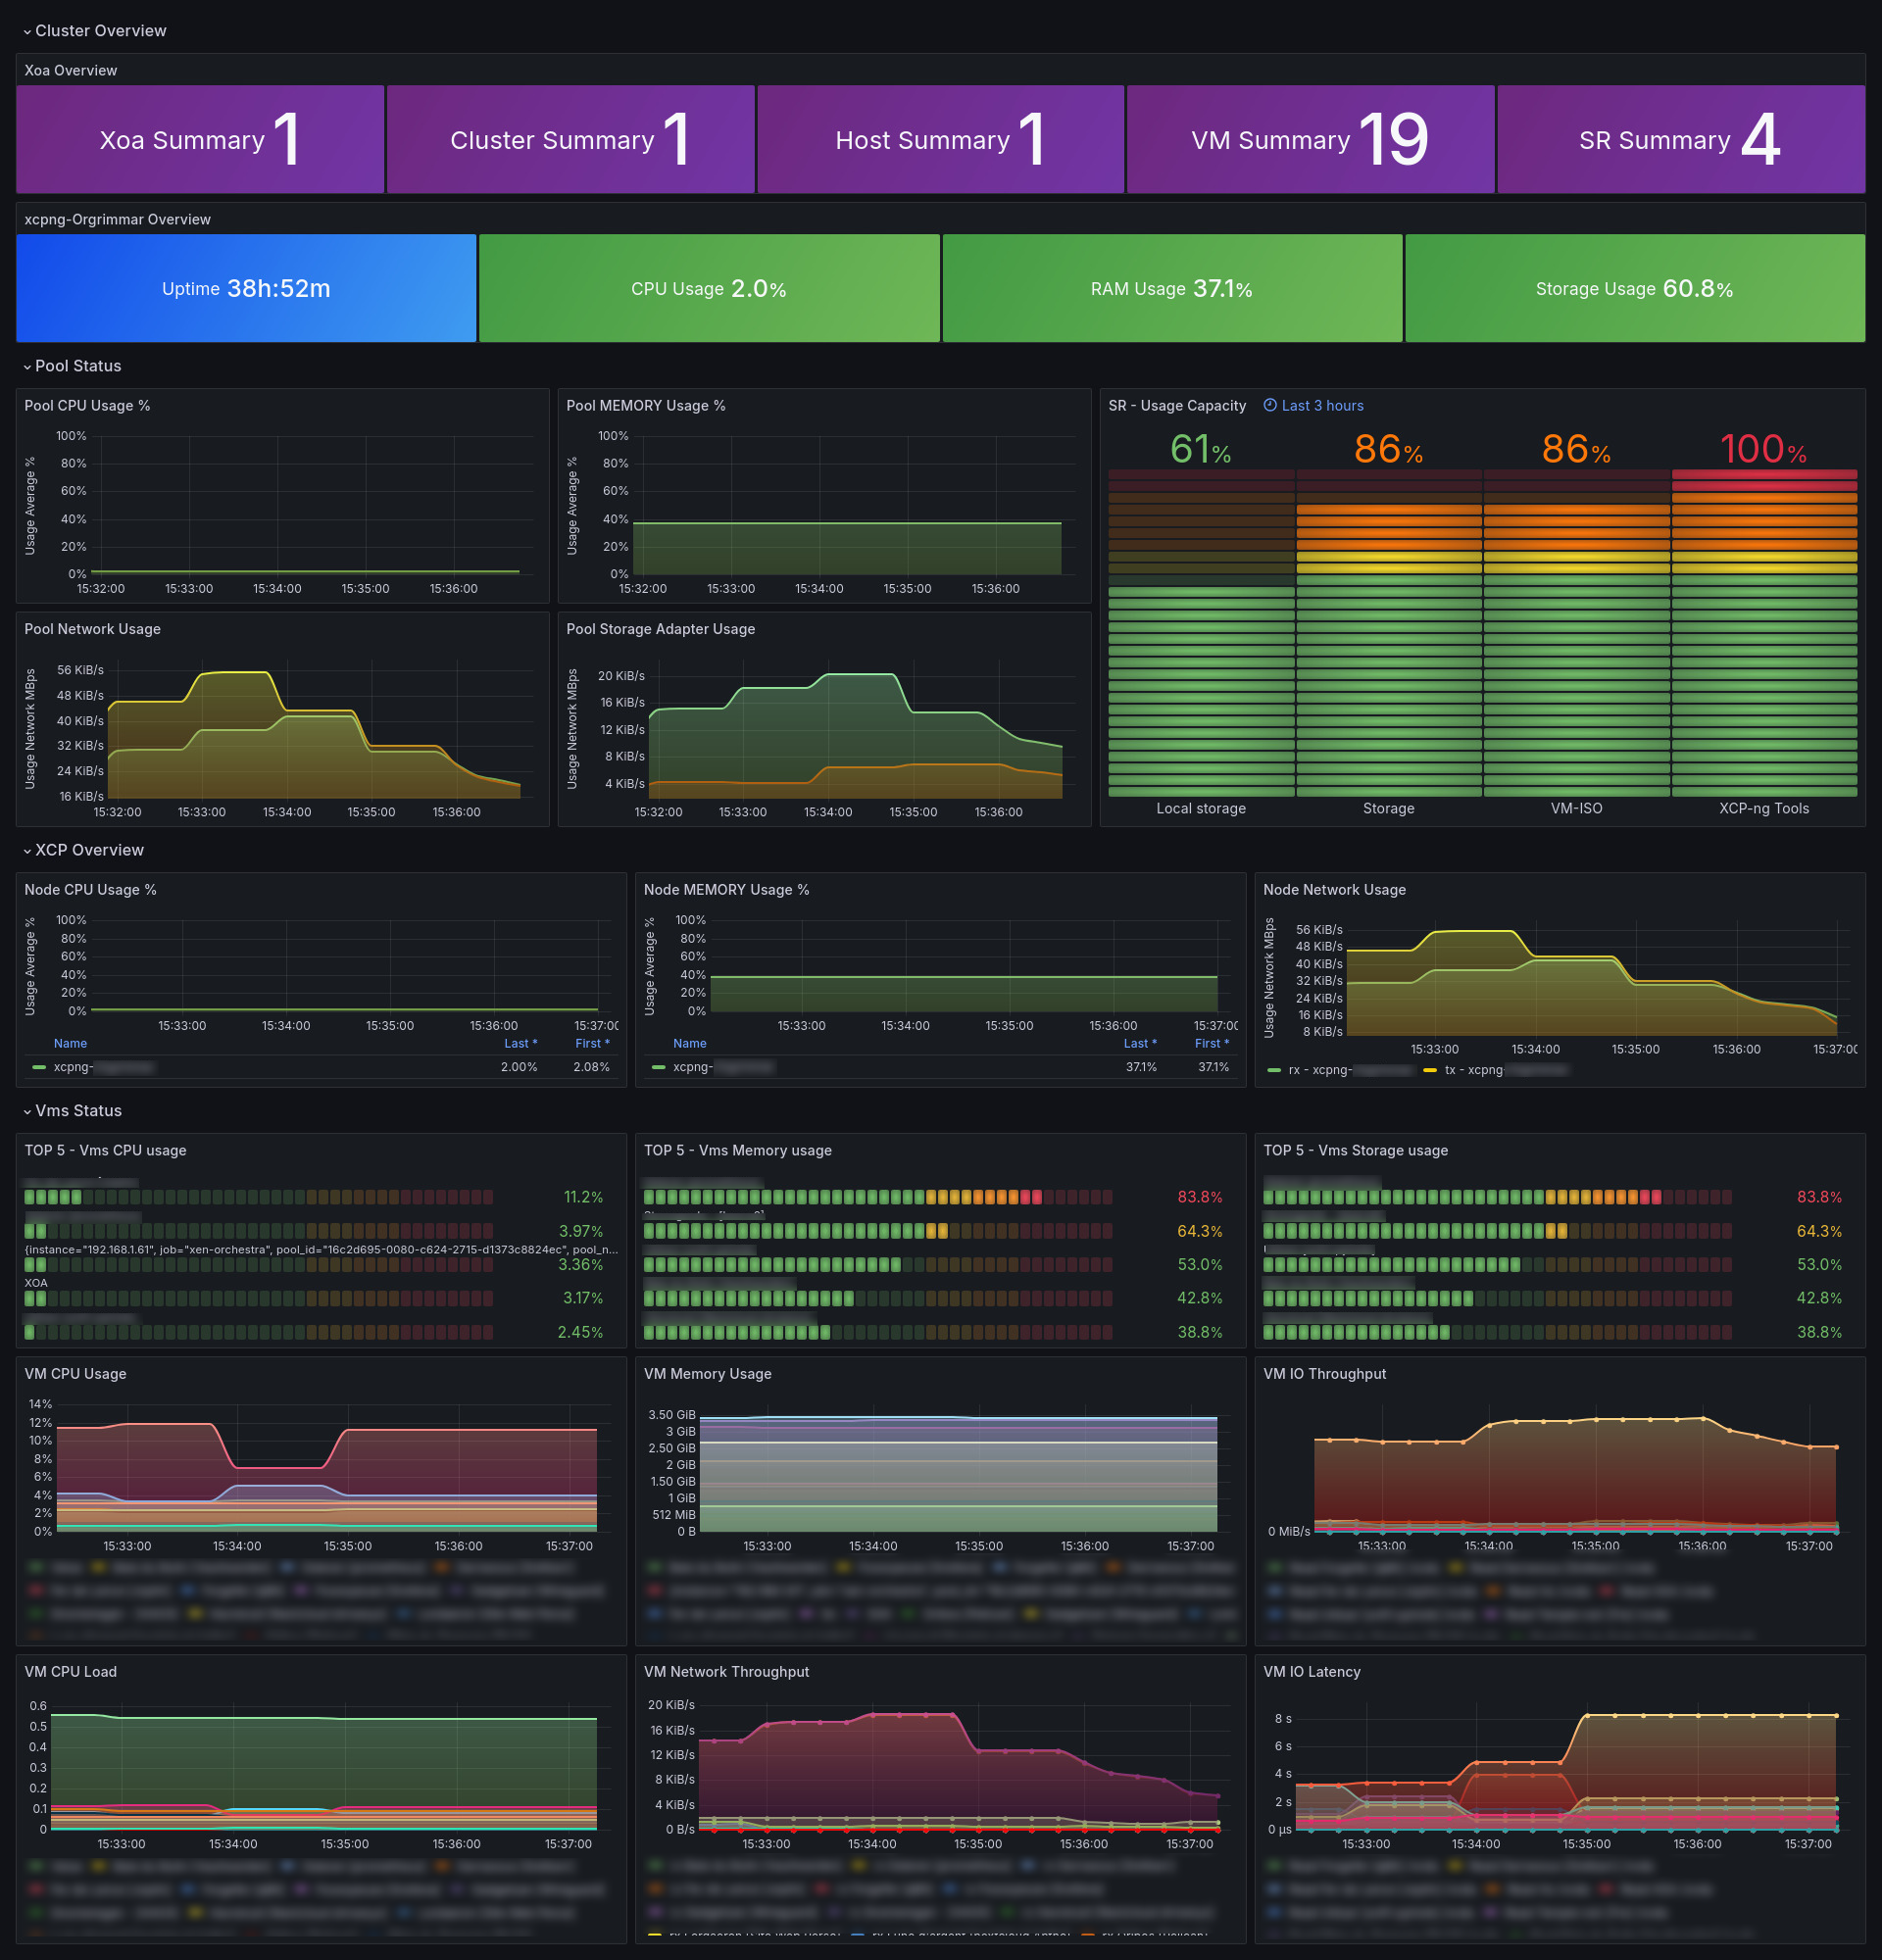
Xoa Cluster Overview
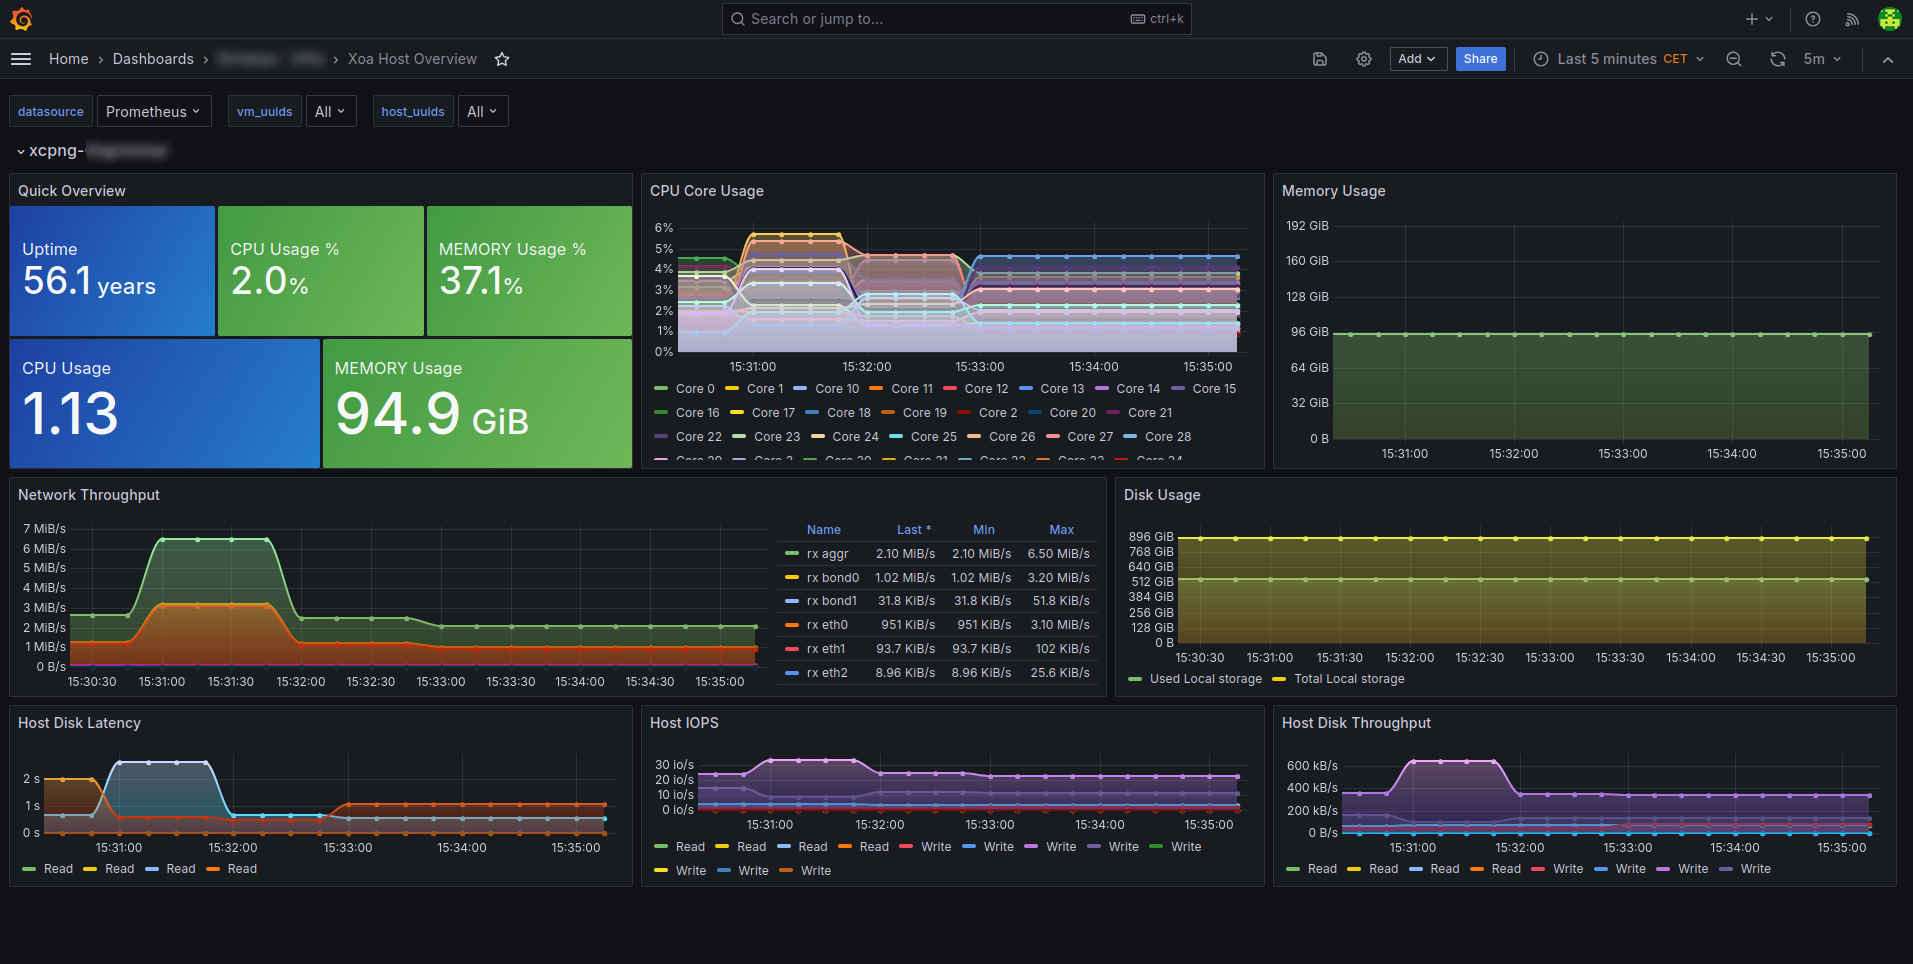
Xoa Host Overview
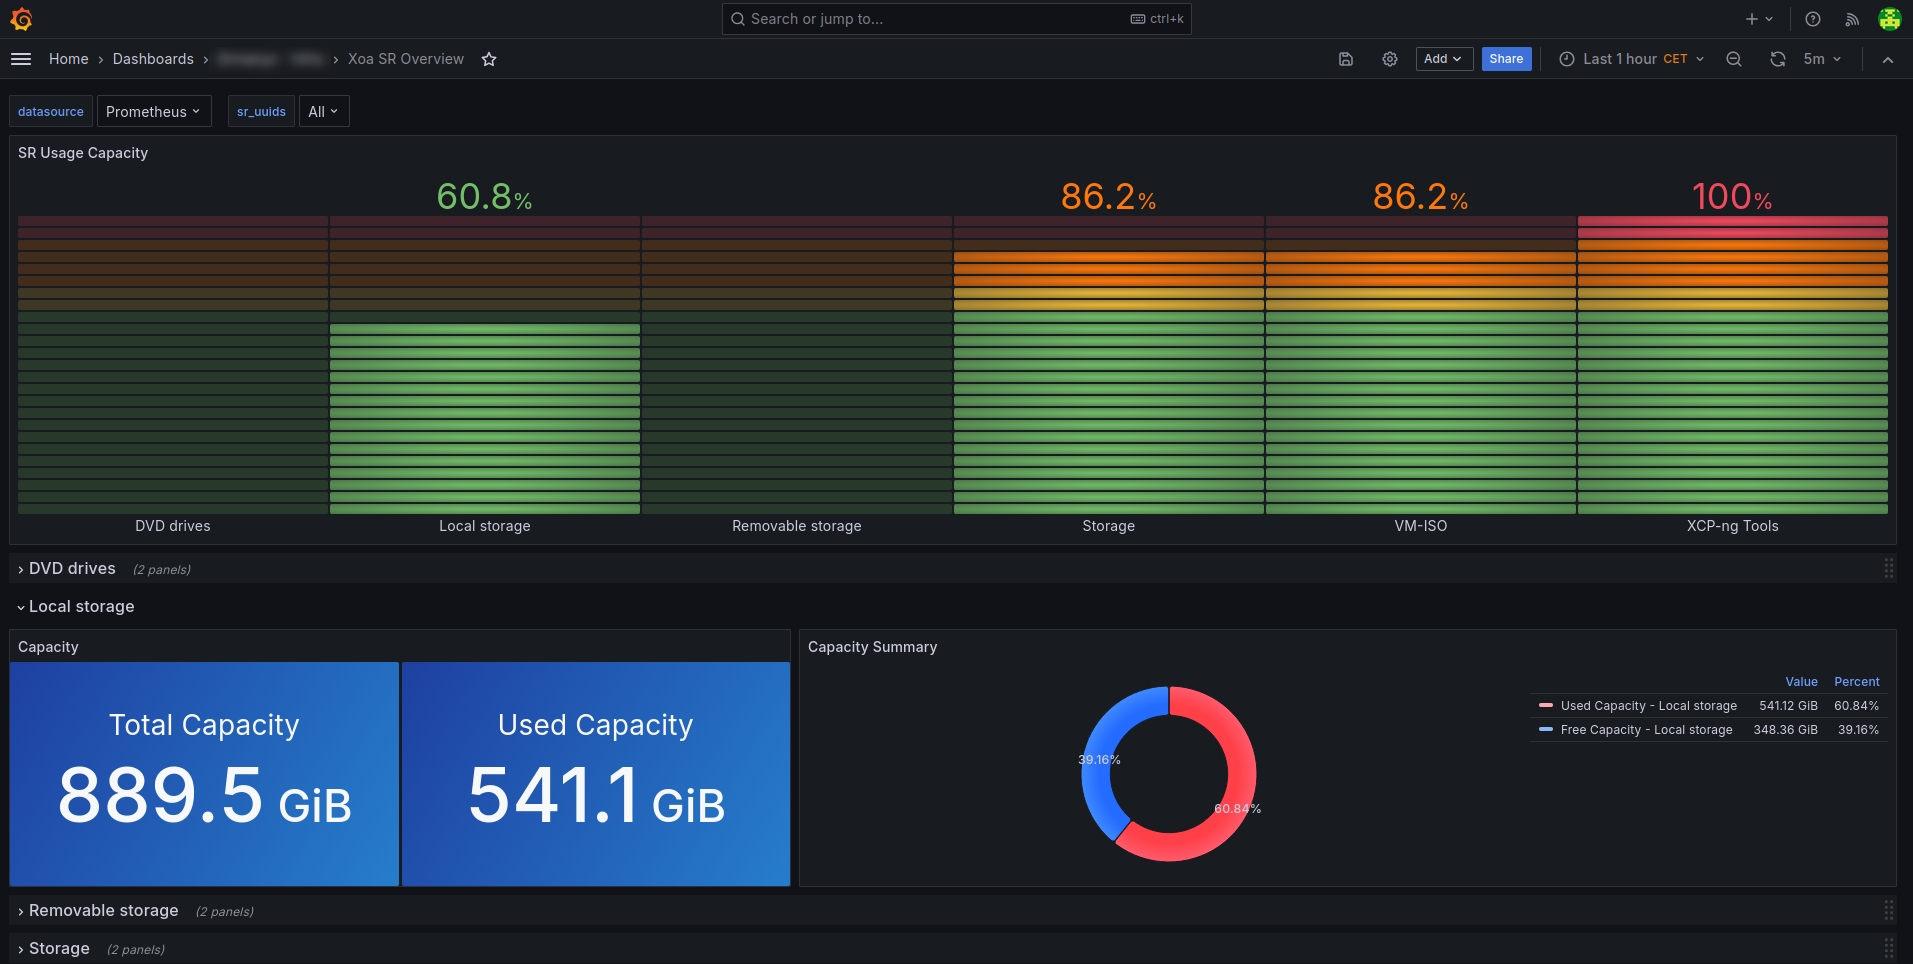
Xoa SR Overview
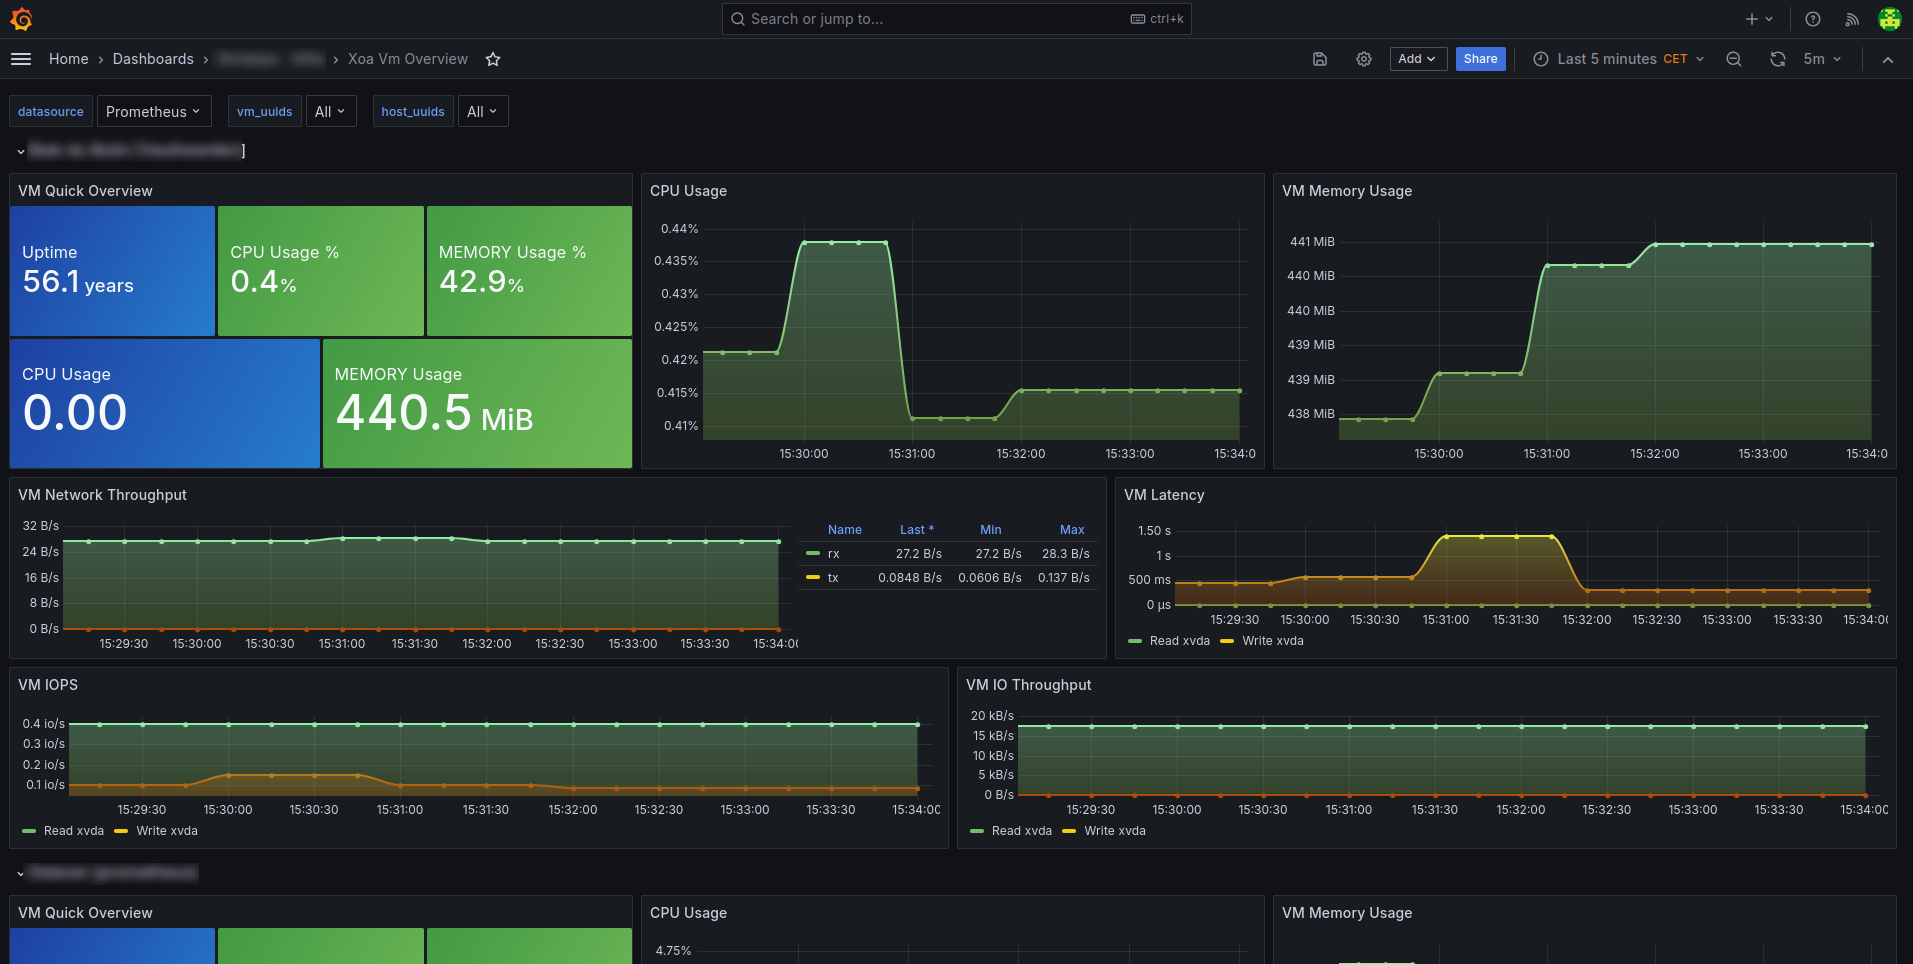
Xoa Vm OverviewDon't hesitate to showcase your dashboards here, share your config files or suggest new metrics !
-
@simonp Is it intended that "host memory usage" and "top VMs by memory usage" show percentage values?
Wouldn't it make more sense if it would show GB / GiB values?
Apart from that: thanks a lot for sharing those dashboards!
-
@MajorP93 Hi,
In the demo dashboard it is intended yes but these percentages are obtained by dividing the free memory by total memory so changing the dashboard to show GB/GiB should be quite straight forward.
I've forgot to add to the initial post that there is a advanced dot md file that describes all the available metrics located in "xen-orchestra/docs/docs".
Thanks.
-
@simonp - Can you reshare the dashboards. The link says json is not available for any of these dashboards,
Hello! It looks like you're interested in this conversation, but you don't have an account yet.
Getting fed up of having to scroll through the same posts each visit? When you register for an account, you'll always come back to exactly where you were before, and choose to be notified of new replies (either via email, or push notification). You'll also be able to save bookmarks and upvote posts to show your appreciation to other community members.
With your input, this post could be even better 💗
Register Login