Alert: Control Domain Memory Usage
-
Hi, i still have this problem on 5 hosts in 2 pools. I increased the dom0 memory to 12GB and 16GB, but its still happening. XCP 8.0 and 8.1 involved. On hosts with more VMs it occures more often then on hosts with less VMs. Its happens between 40 - 140 days, depending on the number of VMs running.
Yes, ownvswitch has the greatest memory usage, but ist still only a small percentage. I still cant see, what eats up the memory. Restarting XAPI doensn`t change anything.
top - 18:37:06 up 144 days, 19:43, 1 user, load average: 2.23, 2.12, 2.16 Tasks: 443 total, 1 running, 272 sleeping, 0 stopped, 0 zombie %Cpu(s): 1.3 us, 1.7 sy, 0.0 ni, 95.7 id, 0.8 wa, 0.0 hi, 0.1 si, 0.4 st KiB Mem : 12205932 total, 91920 free, 11932860 used, 181152 buff/cache KiB Swap: 1048572 total, 807616 free, 240956 used. 24552 avail Mem PID USER PR NI VIRT RES SHR S %CPU %MEM TIME+ COMMAND 2248 root 10 -10 1302696 158708 9756 S 1.0 1.3 2057:54 ovs-vswitchd 3018 root 20 0 597328 25804 4 S 0.3 0.2 635:40.46 xapi 1653 root 20 0 255940 20628 1088 S 0.0 0.2 1517:12 xcp-rrdd 1321 root 20 0 142596 15100 7228 S 0.3 0.1 40:49.02 message-switch 6571 root 20 0 213720 12164 4920 S 0.0 0.1 9:30.58 python 1719 root 20 0 62480 9980 3488 S 0.0 0.1 269:35.54 xcp-rrdd-xenpm 13506 root 20 0 43828 9652 2856 S 0.0 0.1 0:05.11 tapdisk 1721 root 20 0 111596 8684 1592 S 0.0 0.1 337:51.20 xcp-rrdd-iostat 2342 root 20 0 138220 8656 2744 S 0.0 0.1 218:17.74 xcp-networkd 1639 root 20 0 1241012 8428 6024 S 0.0 0.1 150:25.56 multipathd 6092 root 20 0 42428 7924 3924 S 17.2 0.1 2987:48 tapdisk 1649 root 20 0 75116 6980 2192 S 0.0 0.1 294:06.89 oxenstored 5436 root 10 -10 35432 6760 4112 S 0.0 0.1 0:00.03 iscsid 13898 root 20 0 40824 6648 2856 S 0.0 0.1 0:09.13 tapdisk 3547 root 20 0 39852 5564 3376 S 0.7 0.0 54:01.72 tapdisk 3006 root 20 0 40028 5460 2496 S 14.2 0.0 19:10.48 tapdisk 1326 root 20 0 67612 5220 2840 S 0.0 0.0 529:23.01 forkexecd 3027 root 20 0 108028 5176 5176 S 0.0 0.0 0:00.02 xapi-nbd 15298 root 20 0 39644 5156 3940 S 0.7 0.0 853:39.92 tapdisk 3694 root 20 0 238044 5084 5084 S 0.0 0.0 0:01.39 python 6945 root 20 0 39484 4860 3804 S 15.8 0.0 591:05.22 tapdisk 24422 root 20 0 44980 4844 4756 S 0.0 0.0 0:00.22 stunnel 11328 root 20 0 44980 4684 4640 S 0.0 0.0 0:00.06 stunnel 2987 root 20 0 44980 4608 4440 S 0.0 0.0 0:00.29 stunnel 6095 root 20 0 38768 4588 2912 S 0.0 0.0 764:33.14 tapdisk 1322 root 20 0 69848 4388 3772 S 0.0 0.0 1:15.05 varstored-guard 14873 root 20 0 38688 4360 2744 S 0.0 0.0 57:33.78 tapdisk 1329 root 20 0 371368 4244 3664 S 0.0 0.0 0:41.49 snapwatchd 1328 root 20 0 112824 4212 4212 S 0.0 0.0 0:00.02 sshd 2219 root 10 -10 44788 4004 3064 S 0.0 0.0 138:30.56 ovsdb-server 3278 root 20 0 307316 3960 3764 S 0.0 0.0 3:15.34 stunnel 17064 root 20 0 153116 3948 3772 S 0.0 0.0 0:00.16 sshd 30189 root 20 0 38128 3716 2828 S 0.0 0.0 97:30.65 tapdisk@olivierlambert Do you have an idea how to get to the root of this? Is it maybe possible to get some (paid) support to check this?
-
Sounds like a memory leak. It's hard to pinpoint in general. I would say that investigating on 8.2 as soon it's out would be probably a better thing to do (it will be an LTS).
It will be out in beta soon
")
-
Just to add that us too have been experiencing the issue pointed out by Dave since we upgraded to 8.0. Even if the in place upgrade did bump the Dom0 memory from 4 to 8GB, we started to get out of memory errors on the pool master after an uptime of around 60 to 70 days.
Our current solution as mentioned in the thread too, is to icrease the memory for Dom0 to 32GBs but this does only buys us more time until the next reboot.
The main problem is that once this happens, backups start to fail and the only solution is to empty the host and reboot, which can be disruptive to some large VMs that don't seem to support live migration very well.
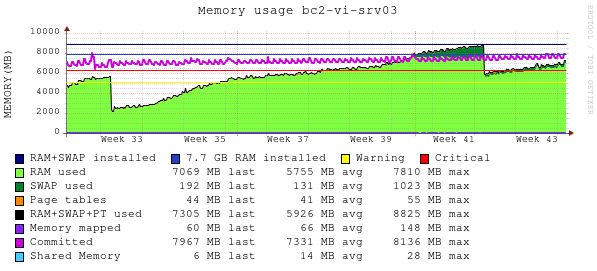
To add some more data, here is a graph of the memory consumption in the master of one of our pools, uptime starts at around week 33 and week 43 is current time (pending a reboot and memory increase for that host). This is a pool of three hosts and 80 vms.
Let me know if we can help with log data or anything else.
-
Please migrate to 8.1 and report if you have the same behavior.
-
@inaki-martinez Could you find out if a specific program uses that memory?
-
@olivierlambert will upgrade our test environment and see if we can see the issue happening again.
@stormi there is nothing using particularly too much ram, listing processes by their RSS rss_usage.txt -
@olivierlambert this still happens at 8.1 also
@stormi it seems that the memory is eating somewhere and doesn't point to specific program. @dave also described here https://xcp-ng.org/forum/post/31693 -
I'd be interested in accessing remotely any host that has this kind of high memory usage without any specific process being an obvious culprit, if someone can give me such access.
-
@stormi I currently have this one:
top - 15:55:55 up 30 days, 19:31,  1 user,  load average: 0.13, 0.19, 0.23
Tasks: 645 total,   1 running, 437 sleeping,   0 stopped,   0 zombie
%Cpu(s):  0.7 us,  0.7 sy,  0.0 ni, 97.9 id,  0.5 wa,  0.0 hi,  0.0 si,  0.2 st
KiB Mem : 12205936 total,   159044 free,  6327592 used,  5719300 buff/cache
KiB Swap:  1048572 total,  1048572 free,        0 used.  5455076 avail Mem

  PID USER      PR  NI    VIRT    RES    SHR S  %CPU %MEM     TIME+ COMMAND
11785 root      20   0   38944   4516   3256 S   3.6  0.0  27:50.89 tapdisk
16619 root      20   0   71988  37640  35464 S   2.0  0.3   1048:44 tapdisk
 2179 root      10 -10 1302860 155032   9756 S   1.7  1.3 699:20.93 ovs-vswitchd
 8627 root      20   0   42496   8276   5896 S   1.3  0.1 645:07.94 tapdisk
12127 65572     20   0  220692  14508   9220 S   1.3  0.1 105:51.34 qemu-system-i38
15573 65567     20   0  228884  14880   9168 S   1.3  0.1 113:17.76 qemu-system-i38
16713 root      20   0   71244  37060  35636 S   1.3  0.3 431:04.58 tapdisk
17124 65565     20   0  253460  15536   9212 S   1.3  0.1 230:28.27 qemu-system-i38
  507 65547     20   0  204308  13576   9176 S   1.0  0.1 374:00.32 qemu-system-i38
 1348 65548     20   0  199188  15852   9268 S   1.0  0.1 478:44.62 qemu-system-i38
 1822 root      20   0  122268  15792   6292 S   1.0  0.1 251:54.49 xcp-rrdd-iostat
 3560 65549     20   0  236052  15696   9272 S   1.0  0.1 478:25.30 qemu-system-i38
 4049 65550     20   0  211476  13712   9096 S   1.0  0.1 374:53.29 qemu-system-i38
 9089 65566     20   0  225812  16328   9236 S   1.0  0.1 226:40.10 qemu-system-i38
19051 65555     20   0  213524  14960   9444 S   1.0  0.1 312:44.65 qemu-system-i38
22650 65540     20   0  231956  14016   9104 S   1.0  0.1 476:19.21 qemu-system-i38
28280 65543     20   0  284180  14356   9180 S   1.0  0.1 481:22.74 qemu-system-i38
28702 65544     20   0  194068  13636   9020 S   1.0  0.1 373:26.97 qemu-system-i38
28981 65568     20   0  174604  15528   9244 S   1.0  0.1 107:15.89 qemu-system-i38
29745 65541     20   0  171532  13792   9132 S   1.0  0.1 476:38.74 qemu-system-i38
 1244 root      20   0   67656   8252   4576 S   0.7  0.1 160:47.13 forkexecd
 4993 root      20   0  180476  10244   3608 S   0.7  0.1  50:10.80 mpathalert
 7194 root      20   0  162508   5052   3824 R   0.7  0.0   0:00.67 top
15180 root      20   0   44744  10500   9328 S   0.7  0.1  26:43.32 tapdisk
16643 65573     20   0  229908  14280   9220 S   0.7  0.1  66:42.94 qemu-system-i38
18769 root      20   0   46616  12316  10912 S   0.7  0.1 241:10.00 tapdisk
22133 65539     20   0   13.3g  16384   9180 S   0.7  0.1 374:26.35 qemu-system-i38
   10 root      20   0       0      0      0 I   0.3  0.0  47:35.79 rcu_sched
 2291 root      20   0  138300  16168   7660 S   0.3  0.1  65:30.99 xcp-networkd
 3029 root      20   0       0      0      0 I   0.3  0.0   0:02.12 kworker/6:0-eve
 3100 root      20   0   95448  17028   9280 S   0.3  0.1  76:30.01 xapi-storage-sc
 3902 root      20   0       0      0      0 I   0.3  0.0   0:07.16 kworker/u32:0-b
 3909 root      20   0       0      0      0 I   0.3  0.0   0:07.48 kworker/u32:4-b
 6663 root      20   0       0      0      0 S   0.3  0.0  70:40.93 kdmwork-253:0
 7826 root      20   0  193828   4224   3668 S   0.3  0.0   0:00.01 login
 8626 root      20   0   71368  37184  35636 S   0.3  0.3 345:42.82 tapdisk
Please contact me with a DM.
-
@dave The situation looks normal to me in this host, with a lot of RAM being used for buffers and cache, contrarily to the starved situation you posted about a month ago. Only half the RAM is counted as used. Is it more than normal?
-
@stormi Of course, sorry. Thats strange, i would have expected the usage would be quite high after 30 days uptime - as it was every time the last year...The usage is quite low, on two Servers which were affected before, ATM.
Before the 30 days seen uptime, i did a yum update on 25.09.2020. A lot of driver and kernel packages were upated in this run.
I have another affected pool, which was restarted 7 days ago because of mem-consumption, but without updating. (lates yum update on 08.05.2020) i will keep an eye on it. Maybe some Updates for 8.1 released beetween 08.05.2020 and 25.09.2020 fixed this error. We will see. -
@dave said in Alert: Control Domain Memory Usage:
Maybe some Updates for 8.1 released beetween 08.05.2020 and 25.09.2020 fixed this error. We will see.
Since that date the updates have been:
- microcode_ctl to fix CROSSTalk vulneratbilities (SRBDS), as well as a kernel patch to reduce the performance overhead of the new microcode
- Xen security updates, not supposed to have any impact on dom0 memory usage
qemusecurity fixes that don't seem related to memory usage at first sight
All the fixes were very specific so I doubt that is what prevented the issue from occurring in your situation, but that remains a possibility.
-
Anyone having such high memory usage, please share the output of
slabtop -o -s c,cat /proc/meminfoandtop(sorted by decreasing MEM%, shortcut for that isM).Previous messages in this thread also suggested two possible culprits:
- (unresponsive) CIFS mounts. Check for their presence.
openvswitch. From recent output oftopshared with us, it doesn't look like it's using that much RAM, but you may try to restart it:systemctl restart openvswitch.service
-
@stormi This is the info for the current pool master with memory issues. The machine had the last OOM event on October 12th.
Slabtop: slabopt.txt
meminfo: meminfo.txt
sorted top: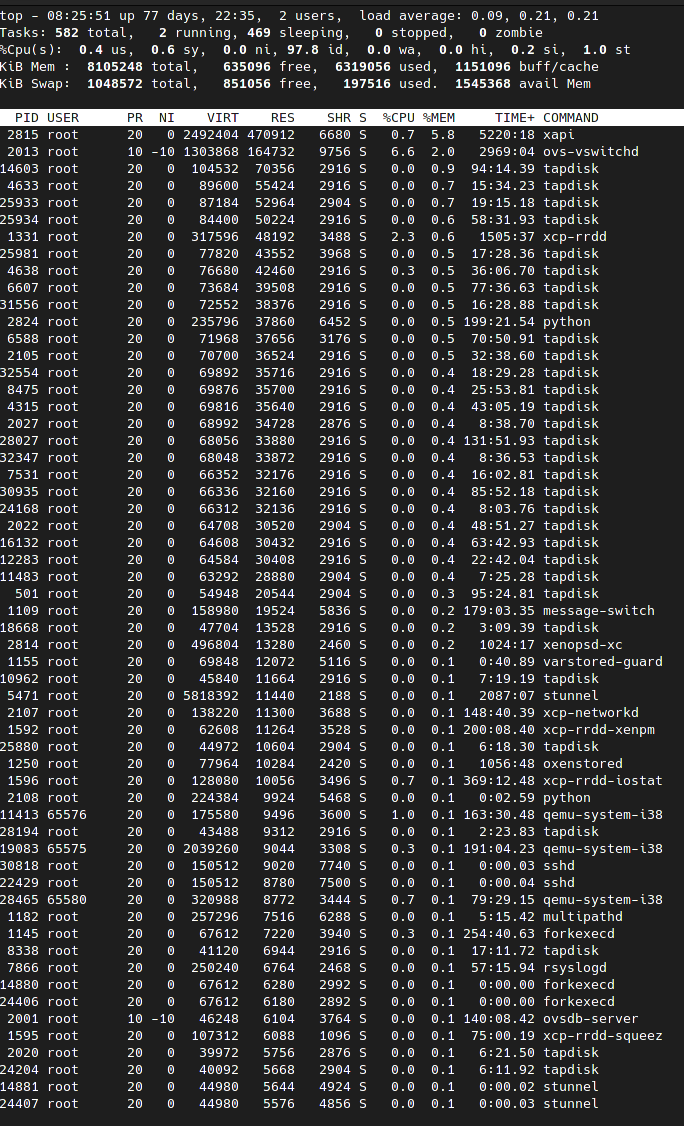
-
@inaki-martinez Thanks. Could you also share the output of
ps aux? And what process got killed by the OOM-killer on Oct 12th?Update: your situation seems to differ from that of @dave described in https://xcp-ng.org/forum/post/31693, because in his case there's almost no memory usage from processes where in your case a more significant part of the used memory is attributed to processes.
-
I have found a host with around 7Gigs om mem used, mostly without a visible process for it.
This is a host which runs less VMs, so it takes longer to fill up the RAM.
slabtop.txt meminfo.txt
ps aux.txttop - 12:15:02 up 60 days, 59 min, 2 users, load average: 0.25, 0.13, 0.10 Tasks: 297 total, 1 running, 189 sleeping, 0 stopped, 0 zombie %Cpu(s): 0.5 us, 0.4 sy, 0.0 ni, 98.6 id, 0.4 wa, 0.0 hi, 0.0 si, 0.1 st KiB Mem : 12210160 total, 3879276 free, 7295660 used, 1035224 buff/cache KiB Swap: 1048572 total, 1048572 free, 0 used. 4691716 avail Mem PID USER PR NI VIRT RES SHR S %CPU %MEM TIME+ COMMAND 2516 root 20 0 866796 92696 25116 S 0.3 0.8 222:40.81 xapi 1947 root 10 -10 712372 89348 9756 S 0.7 0.7 594:52.86 ovs-vswitchd 1054 root 20 0 102204 30600 15516 S 0.3 0.3 22:13.27 message-switch 2515 root 20 0 493252 25328 12884 S 0.0 0.2 119:46.39 xenopsd-xc 2527 root 20 0 244124 25128 8952 S 0.0 0.2 0:24.59 python 1533 root 20 0 277472 23956 7928 S 0.0 0.2 155:35.64 xcp-rrdd 2514 root 20 0 95448 19204 11588 S 0.0 0.2 100:44.55 xapi-storage-sc 1069 root 20 0 69952 17980 9676 S 0.0 0.1 0:22.94 varstored-guard 2042 root 20 0 138300 17524 9116 S 0.3 0.1 68:39.86 xcp-networkd 2524 root 20 0 211576 17248 7728 S 0.0 0.1 7:57.55 python 2041 root 20 0 223856 16836 7840 S 0.0 0.1 0:00.28 python 26502 65539 20 0 331284 16236 9340 S 1.0 0.1 580:03.42 qemu-system-i38 5724 65540 20 0 208404 15400 9240 S 0.7 0.1 450:29.20 qemu-system-i38 2528 root 20 0 108192 14760 10284 S 0.0 0.1 0:00.01 xapi-nbd 9482 65537 20 0 316948 14204 9316 S 0.3 0.1 541:50.85 qemu-system-i38 24445 65541 20 0 247308 13704 9124 S 0.7 0.1 71:45.92 qemu-system-i38 1649 root 20 0 62552 13340 6172 S 0.0 0.1 58:24.21 xcp-rrdd-xenpm 1650 root 20 0 109848 13320 6388 S 0.0 0.1 102:33.45 xcp-rrdd-iostat 1294 root 20 0 127660 11044 5848 S 0.0 0.1 43:57.60 squeezed 1647 root 20 0 115764 10944 6008 S 0.0 0.1 47:06.07 xcp-rrdd-squeez 26131 root 20 0 45096 10920 3024 S 0.0 0.1 10065:02 tapdisk 4781 root 20 0 180476 10816 5832 S 0.0 0.1 41:45.65 mpathalert 1725 root 20 0 987212 10024 8116 S 0.0 0.1 0:02.70 lwsmd 25383 root 20 0 155244 9824 8488 S 0.0 0.1 0:00.06 sshd 1068 root 20 0 222612 9756 5544 S 0.0 0.1 39:12.40 v6d 1648 root 20 0 196692 9688 5364 S 0.0 0.1 38:58.31 xcp-rrdd-gpumon 3198 root 20 0 4178388 9488 4160 S 0.0 0.1 22:03.95 stunnel 1603 root 20 0 1187748 8476 6724 S 0.0 0.1 0:00.05 lwsmd 1055 root 20 0 67656 8432 4764 S 0.0 0.1 118:55.38 forkexecd 1691 root 20 0 1060428 7840 6256 S 0.0 0.1 0:00.01 lwsmd 1073 root 20 0 112824 7752 6724 S 0.0 0.1 0:00.01 sshd 1558 root 20 0 322832 7652 6292 S 0.0 0.1 2:47.05 multipathd 1263 root 20 0 73568 7548 3620 S 0.0 0.1 52:55.82 oxenstored 1651 root 20 0 774588 7144 5732 S 0.0 0.1 0:00.01 lwsmd 23598 root 20 0 67656 6664 2988 S 0.0 0.1 0:00.00 forkexecd 1576 root 20 0 1016092 6348 4920 S 0.0 0.1 0:00.02 lwsmd 5170 root 10 -10 34412 5784 4112 S 0.0 0.0 0:00.00 iscsid 23599 root 20 0 44980 5696 4968 S 0.0 0.0 0:00.00 stunnel 1 root 20 0 43816 5460 3792 S 0.0 0.0 17:48.63 systemd 26109 root 20 0 39700 5396 3024 S 0.0 0.0 272:18.60 tapdisk 1032 root 20 0 266820 5352 3284 S 0.0 0.0 31:45.39 rsyslogd 1935 root 10 -10 44740 5260 3800 S 0.0 0.0 20:40.87 ovsdb-server 26226 root 20 0 39460 5160 3284 S 1.0 0.0 975:42.44 tapdisk 14571 root 20 0 196608 5044 4388 S 0.0 0.0 0:00.01 login 25491 root 20 0 162332 4676 3764 R 0.0 0.0 0:00.62 top 5305 root 20 0 38944 4668 3024 S 0.3 0.0 88:02.03 tapdisk 9231 root 20 0 38676 4528 3024 S 0.0 0.0 24:38.80 tapdisk 1469 root 20 0 21428 4508 1764 S 0.0 0.0 9:47.96 cdrommon 24991 root 20 0 162116 4508 3664 S 0.0 0.0 0:00.73 top 14758 root 20 0 116504 4420 3008 S 0.0 0.0 0:00.02 bash 24342 root 20 0 38560 4412 3024 S 0.0 0.0 1:04.19 tapdisk 1042 dbus 20 0 58120 4328 3824 S 0.0 0.0 1:14.70 dbus-daemon 2049 root 20 0 63560 4288 2988 S 0.0 0.0 0:00.00 forkexecd 25437 root 20 0 116500 4264 2916 S 0.0 0.0 0:00.03 bash 1064 root 20 0 24504 4008 3328 S 0.0 0.0 0:00.11 smartd 6542 root 20 0 115968 3808 2932 S 0.0 0.0 0:23.13 sh -
@Dave @inaki-martinez for info, can you share
# sarof the day it went OOM? -
@dave So, at this point our theories are:
- dom0 memory ballooning
- a kernel memory leak
- each of us being really bad at understanding RAM usage in dom0

Can you share the contents of your
grub.cfg, the line starting with "Domain-0" in the output ofxl top, and output ofxe vm-param-list uuid={YOUR_DOM0_VM_UUID} | grep memory? -
@stormi this is the current ps aux: ps-aux.txt
@r1 the sar file is too big to add it here but here is a link sar.txt (valid for a day), and the kernel oom message too messages.txt . From what I can see only around 3GB where accounted for when the OOM killer was triggered (Dom0 has 8GB of memory available).
In this case rsyslog was killed but I have seen xapi killed on other occasions. I can dig up the logs if they can help. -
- grub.cfg grub.txt
- xl top for Dom0
Domain-0 -----r 5461432 0.0 8388608 1.6 8388608 1.6 16 0 0 0 0 0 0 0 0 0 0 - xe param list for Dom0 (memory)
                         memory-target ( RO): <unknown>
                       memory-overhead ( RO): 118489088
                     memory-static-max ( RW): 8589934592
                    memory-dynamic-max ( RW): 8589934592
                    memory-dynamic-min ( RW): 8589934592
                     memory-static-min ( RW): 4294967296
                      last-boot-record ( RO): '('struct' ('uuid' '5e1386d5-e2c9-47eb-8445-77674d76c803') ('allowed_operations' ('array')) ('current_operations' ('struct')) ('power_state' 'Running') ('name_label' 'Control domain on host: bc2-vi-srv03') ('name_description' 'The domain which manages physical devices and manages other domains') ('user_version' '1') ('is_a_template' ('boolean' '0')) ('is_default_template' ('boolean' '0')) ('suspend_VDI' 'OpaqueRef:NULL') ('resident_on' 'OpaqueRef:946c6678-044a-62ab-2a98-f8c93e34ade9') ('affinity' 'OpaqueRef:946c6678-044a-62ab-2a98-f8c93e34ade9') ('memory_overhead' '84934656') ('memory_target' '4294967296') ('memory_static_max' '4294967296') ('memory_dynamic_max' '4294967296') ('memory_dynamic_min' '4294967296') ('memory_static_min' '4294967296') ('VCPUs_params' ('struct')) ('VCPUs_max' '48') ('VCPUs_at_startup' '48') ('actions_after_shutdown' 'destroy') ('actions_after_reboot' 'destroy') ('actions_after_crash' 'destroy') ('consoles' ('array' 'OpaqueRef:aa16584e-48c6-70a3-98c0-a2ee63b3cfa4' 'OpaqueRef:01efe105-d6fe-de5e-e214-9c6e2b5be498')) ('VIFs' ('array')) ('VBDs' ('array')) ('crash_dumps' ('array')) ('VTPMs' ('array')) ('PV_bootloader' '') ('PV_kernel' '') ('PV_ramdisk' '') ('PV_args' '') ('PV_bootloader_args' '') ('PV_legacy_args' '') ('HVM_boot_policy' '') ('HVM_boot_params' ('struct')) ('HVM_shadow_multiplier' ('double' '1')) ('platform' ('struct')) ('PCI_bus' '') ('other_config' ('struct' ('storage_driver_domain' 'OpaqueRef:166e5128-4906-05cc-bb8d-ec99a3c13dc0') ('is_system_domain' 'true'))) ('domid' '0') ('domarch' 'x64') ('last_boot_CPU_flags' ('struct')) ('is_control_domain' ('boolean' '1')) ('metrics' 'OpaqueRef:2207dad4-d07f-d7f9-9ebb-796072aa37e1') ('guest_metrics' 'OpaqueRef:NULL') ('last_booted_record' '') ('recommendations' '') ('xenstore_data' ('struct')) ('ha_always_run' ('boolean' '0')) ('ha_restart_priority' '') ('is_a_snapshot' ('boolean' '0')) ('snapshot_of' 'OpaqueRef:NULL') ('snapshots' ('array')) ('snapshot_time' ('dateTime.iso8601' '19700101T00:00:00Z')) ('transportable_snapshot_id' '') ('blobs' ('struct')) ('tags' ('array')) ('blocked_operations' ('struct')) ('snapshot_info' ('struct')) ('snapshot_metadata' '') ('parent' 'OpaqueRef:NULL') ('children' ('array')) ('bios_strings' ('struct')) ('protection_policy' 'OpaqueRef:NULL') ('is_snapshot_from_vmpp' ('boolean' '0')) ('snapshot_schedule' 'OpaqueRef:NULL') ('is_vmss_snapshot' ('boolean' '0')) ('appliance' 'OpaqueRef:NULL') ('start_delay' '0') ('shutdown_delay' '0') ('order' '0') ('VGPUs' ('array')) ('attached_PCIs' ('array')) ('suspend_SR' 'OpaqueRef:NULL') ('version' '0') ('generation_id' '') ('hardware_platform_version' '0') ('has_vendor_device' ('boolean' '0')) ('requires_reboot' ('boolean' '0')) ('reference_label' ''))'
                                memory (MRO): <not in database>
Hello! It looks like you're interested in this conversation, but you don't have an account yet.
Getting fed up of having to scroll through the same posts each visit? When you register for an account, you'll always come back to exactly where you were before, and choose to be notified of new replies (either via email, or push notification). You'll also be able to save bookmarks and upvote posts to show your appreciation to other community members.
With your input, this post could be even better 💗
Register Login