Alert: Control Domain Memory Usage
-
Thanks! feedback is vital to help us
")
-
FWIW, no kubernetes in our environment with this issue.
-
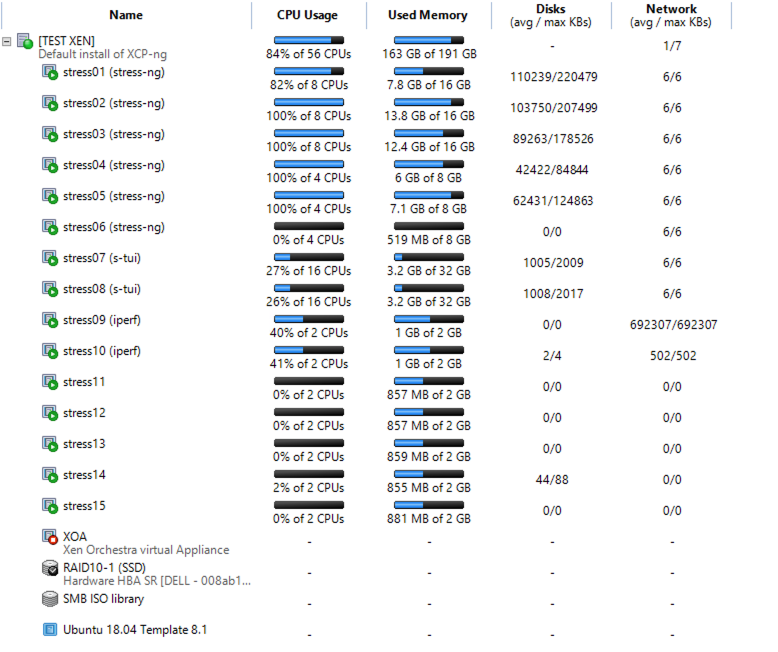
Some feedback on some testing that I have done.
I have spun up some vms and done some stress testing on them, with a combination of stress-ng, s-tui and iperf and though slow, I can see a drop over time of DOM0 free memory- 26.1.2021 -- 662 MB used -- 6307 MB free (initial)
- 27.1.2021 -- 726 MB used -- 6270 MB free
- 28.1.2021 11:36 AM -- 840 MB used -- 6123 MB free
- 28.1.2021 12:23 AM -- 866 MB used -- 6191 MB free
- 28.1.2021 3:59 PM -- 877 MB used -- 6056 MB free
- 28.1.2021 4:35 PM -- 883 MB used -- 6048 MB free
- 29.1.2021 7:32 AM -- 897 MB used -- 6004 MB free
This is my setup - XCP-ng 18.0 standard kernel
Below are some notes on what I did to do this test.
DOM0 Memory issue.txtI'll try now with different kernels / upgrading to XCP-ng 8.2 (both standard and alternative kernels) and see if I can continue to replicate the issue.
Re: kubernetes - not sure 100% if that is causing it, it just seems to be a common factor but based on the stress testing, lots of cpu/memory/io seems to be causing DOM0 memory usage to increase.
-
@fasterfourier
Can I ask what version of XCP-ng that you are running along with the OS version / Kubernetes version you are running? Still trying to work out what may be causing this. -
@garyabrahams What about alt kernel?
-
@olivierlambert
I installed that this morning and running my tests for a few hours (so only a short period of time)
So far I have seen this on dom0 (via free -m)
I'm running XCP-ng 8.0- 29.1.2021 9:07 AM -- 749 used - 6688 free (initial with all vms running, but no programs)
- 29.1.2021 9:15 AM -- 767 used - 6673 free (vms running, all tests running)
- 29.1.2021 9:46 AM -- 778 used - 6654 free
- 29.1.2021 10:51 AM -- 793 used - 6630 free
Linux cpt-dc-xen02 4.19.68 #1 SMP Fri Sep 27 10:14:57 CEST 2019 x86_64 x86_64 x86_64 GNU/Linux
-
So is it better than before?
-
Still checking. Going to run for another day and see.
Should the memory usage in DOM0 be dropping as part of normal use?
I understand ram usage going up and down just like a normal OS, but a constant increase in memory usage doesn't seem right to me or am I misunderstanding how this work?
Gary
-
"Depends". But you shouldn't have invisible RAM used.
-
Sorry I was unclear, but we are not running Kubernetes in our environment. We are running Citrix Hypervisor 8.2 LTSR.
-
I have another observation to throw in the thread here. In working with Citrix support on our dom0 memory exhaustion issue in CH8.2LTSR, they are focusing on several of our VMs that had dynamic memory control enabled, which is deprecated in CH8.x. They believe this is related to the control domain memory exhaustion.
I have disabled this on all VMs that I can find with the feature enabled and will continue to monitor. I don't have much hope that this is the underlying issue, since we are seeing the memory issue on our pool master, which could only have hosted a VM with DMA enabled for very brief periods of time while other VMs were shuffled around for maintenance.
Does this track with anyone else here?
-
This is... Surprising. I thought
xl topwould allow to rule that out very fast (and it did earlier in this thread when I suspected something related to dom0 memory ballooning). Unless Xen leaks the memory in some way that would not be visible to itself. I don't know if that is even possible and I don't see how that would relate at all with the memory used by dom0, even if there was such a leak related to domU DMC. -
I am also suspicious of this diagnosis, and I think this is likely related to checking off the "misalignments" in our configuration before escalating the case to the next level of troubleshooting support. That said, I figured I'd run it by the group here to see if there's any correlation between users with dynamic memory on their VMs and this issue.
-
The boxes that I have do not have dynamic memory (never used it), and we are getting the issue.
Some feedback on my test box running 8.0 alternative kernel. Been running it for a week and getting this.
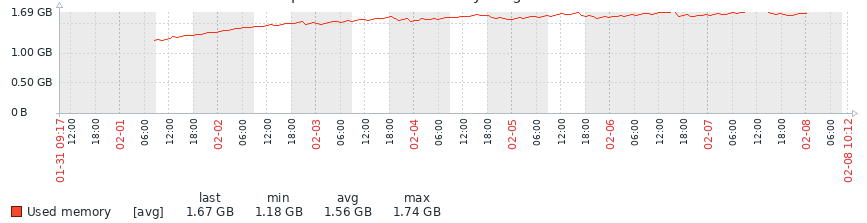
As you can see there was a increase in memory of the first few days, but then it seemed to level off. I'll continue to do some tests, then I'm intending to upgrade to 8.2 and see if I can replicate (both with the standard and alternative kernels).
I'll provide feedback once I have it.
Gary
-
I have another production box that has this issue.. and noticed this
[10:41 host ~]# free -m
              total        used        free      shared  buff/cache   available
Mem:           7913        6445          77         210        1390         284
Swap:          1023          41         982

[10:41 host ~]# ps -ef | grep sadc | wc -l
6337

[10:41 host ~]# ps -ef | grep CROND | wc -l
6337

[10:41 host ~]# ps -ef | grep 32766
root       306 32766  0 Jan31 ?        00:00:00 /usr/lib64/sa/sadc -F -L -S DISK 1 1 -
root     32766  2898  0 Jan31 ?        00:00:00 /usr/sbin/CROND -n
Not sure why I have 6337 processes for CROND and sadc, but going to do some investigations
-
[10:36 xs03 ~]# free -m
              total        used        free      shared  buff/cache   available
Mem:          11921       11322         171         151         427         175
Swap:          1023          37         986
[10:36 xs03 ~]# ps -ef | grep CROND | wc -l
1
BTW: All my affected pools never had dynamic memory.
-
@garyabrahams I think this is a separate issue that would deserve a separate thread, though it's interesting to have mentioned it here just in case someone else would have noticed something similar (I don't remember anyone mentioning such proliferation of processes in this thread).
Now, maybe that host also is affected by the memory leak, but for now nothing allows to think both issues are related. Or maybe the lack of free memory is what caused the processes to never quit.
-
Update: we have disabled dynamic memory on all VMs in our pool and the issue is still occurring.I expect this to be sent to the citrix developers shortly, since the normal support team has exhausted their troubleshooting options.
-
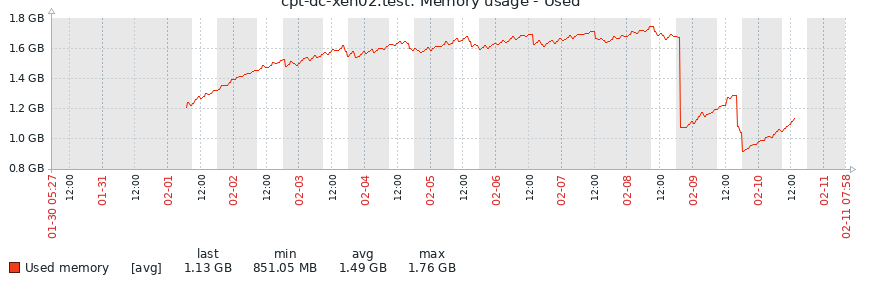
An update from my side.
I have tried 8.0 alt kernel, 8.2 standard kernel and 8.2 alt kernel and in each case the memory usage increased over timeBelow the first increase is 8.0 alt kernel, 2nd increase was 8.2 standard and 3rd 8.2 alt kernel.
-
I don't think there's enough time to really be sure about the memory leak. It's normal to see raising RAM usage, what's not is to consume all the dom0. Can you wait a bit longer between 2 tests?
Hello! It looks like you're interested in this conversation, but you don't have an account yet.
Getting fed up of having to scroll through the same posts each visit? When you register for an account, you'll always come back to exactly where you were before, and choose to be notified of new replies (either via email, or push notification). You'll also be able to save bookmarks and upvote posts to show your appreciation to other community members.
With your input, this post could be even better 💗
Register Login