Bad Performance CPU? get-cpufreq-para failed
-
Hi @ all,
I am using since about ten year Xenserver and tested it on several platforms.
It runs on all configuration i have every tried and the most of it are not build for such usage.2 weeks ago I have get an ProLiant DL380p Gen8 with two E5-2680.
At first nothing unusual during installation an migration. But then I tested some Windows 10 VMs and there are extremely slow. I comparison to another system they are about ten times slower.after some research in the forum I have found the following topic:
xcp-ng CPU low performance issue
If I want to get some CPU information i will get this:
[07:18 localhost ~]# sudo xenpm get-cpufreq-para
[CPU0] failed to get cpufreq parameter
[CPU1] failed to get cpufreq parameter
[CPU2] failed to get cpufreq parameter
...
[CPU62] failed to get cpufreq parameter
[CPU63] failed to get cpufreq parameter
It seem to be xen can´t get clean access to the CPU?
[12:47 localhost ~]# cat /proc/cpuinfo | grep -i mhz
cpu MHz: 2693.528
cpu MHz: 2693.528
cpu MHz: 2693.528
cpu MHz: 2693.528
cpu MHz: 2693.528
…
Are there anyone who has solved such a problem?
-
Hi,
Check in your BIOS that you are in performance mode or equivalent.
-
I have checked the BIOS: PowerManament is set to static Performance
there was no change...the CPU parameter are still not avail
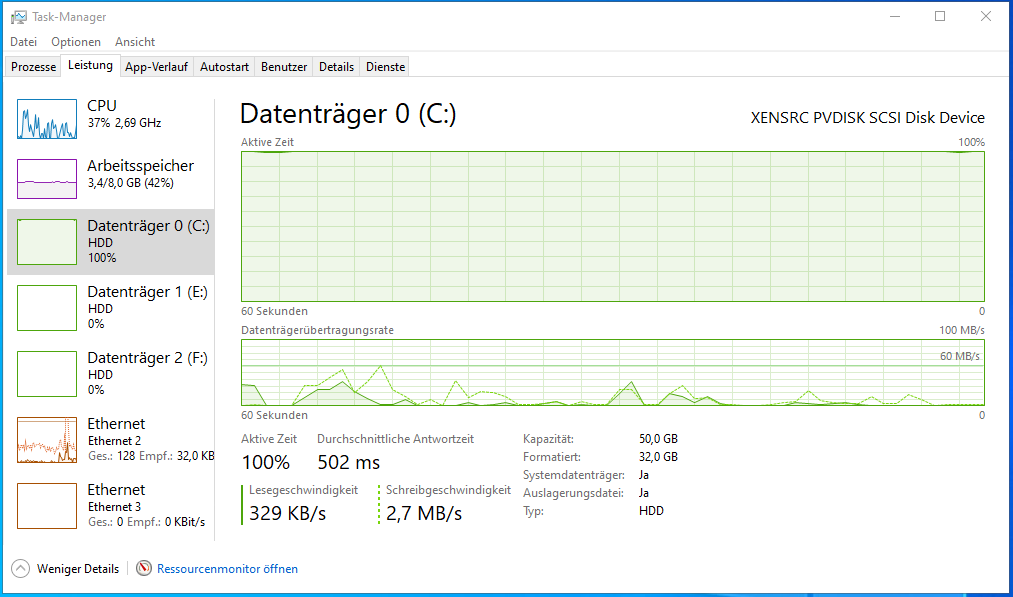
further the HDD load in the VM is strange, the disk load is without any started app permanently at 100%
High Disk load without any started app:
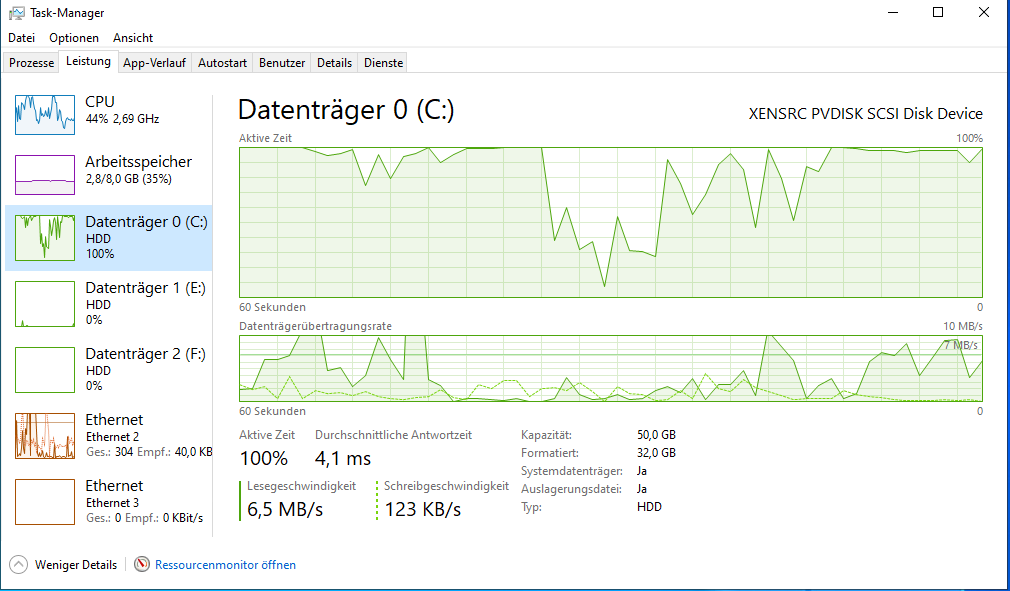
high CPU load after start without any started app:
-
So your issue is probably more storage related than CPU related
-
@olivierlambert I think it could be both... but how can i figure it out where are the this came from?
it is a fresh installed system.
-
It's hard to tell, you have the infrastructure "in front of you", while I have 0 knowledge here.
-
that is correct, but there are no errors in the storage system. the raid is built with two Raid 10 arrays SAS disks. the performance should be there.
a better question should be, how to figure it out driver issues?
The issue with the CPU looks strange and i don´t know how to find out why the cpu data could be not show with xenpmI think I will make some test with a linux vm look how the performance is there.
-
You must provide more technical details on the entire system/setup, including the storage & network.
-
This also happens on our servers.
This is from a single node homelab running on a Dell PowerEdge r620
# xenpm get-cpufreq-para
[CPU0] failed to get cpufreq parameter
[CPU1] failed to get cpufreq parameter
[CPU2] failed to get cpufreq parameter
[CPU3] failed to get cpufreq parameter
[CPU4] failed to get cpufreq parameter
[CPU5] failed to get cpufreq parameter
[CPU6] failed to get cpufreq parameter
[CPU7] failed to get cpufreq parameter
[CPU8] failed to get cpufreq parameter
[CPU9] failed to get cpufreq parameter
[CPU10] failed to get cpufreq parameter
[CPU11] failed to get cpufreq parameter
[CPU12] failed to get cpufreq parameter
[CPU13] failed to get cpufreq parameter
[CPU14] failed to get cpufreq parameter
[CPU15] failed to get cpufreq parameter
[CPU16] failed to get cpufreq parameter
[CPU17] failed to get cpufreq parameter
[CPU18] failed to get cpufreq parameter
[CPU19] failed to get cpufreq parameter
[CPU20] failed to get cpufreq parameter
[CPU21] failed to get cpufreq parameter
[CPU22] failed to get cpufreq parameter
[CPU23] failed to get cpufreq parameter
[CPU24] failed to get cpufreq parameter
[CPU25] failed to get cpufreq parameter
[CPU26] failed to get cpufreq parameter
[CPU27] failed to get cpufreq parameter
[CPU28] failed to get cpufreq parameter
[CPU29] failed to get cpufreq parameter
[CPU30] failed to get cpufreq parameter
[CPU31] failed to get cpufreq parameter
[CPU32] failed to get cpufreq parameter
[CPU33] failed to get cpufreq parameter
[CPU34] failed to get cpufreq parameter
[CPU35] failed to get cpufreq parameter
[CPU36] failed to get cpufreq parameter
[CPU37] failed to get cpufreq parameter
[CPU38] failed to get cpufreq parameter
[CPU39] failed to get cpufreq parameter
[CPU40] failed to get cpufreq parameter
[CPU41] failed to get cpufreq parameter
[CPU42] failed to get cpufreq parameter
[CPU43] failed to get cpufreq parameter
[CPU44] failed to get cpufreq parameter
[CPU45] failed to get cpufreq parameter
[CPU46] failed to get cpufreq parameter
[CPU47] failed to get cpufreq parameter
# cat /proc/cpuinfo | egrep -i mhz cpu MHz : 2700.059 cpu MHz : 2700.059 cpu MHz : 2700.059 cpu MHz : 2700.059 cpu MHz : 2700.059 cpu MHz : 2700.059 cpu MHz : 2700.059 cpu MHz : 2700.059 cpu MHz : 2700.059 cpu MHz : 2700.059 cpu MHz : 2700.059 cpu MHz : 2700.059 cpu MHz : 2700.059 cpu MHz : 2700.059 cpu MHz : 2700.059 cpu MHz : 2700.059 -
@olivierlambert
Ok no proplem.Servertype: HP ProLiant DL380p Gen8
CPU 2 x Xeon(R) CPU E5-2680 0 @ 2.70GHzRAM 128GB DDR3 1333Mhz ECC RAM
Storage 8x 900GB SAS 10K Disks at P420i Raid Controller
Configured as:
1x 1,8 TB RAID 1+0 (4 Disks)
1x 1,8 TB RAID 1+0 (4 Disks)[11:55 localhost ~]# pvs PV VG Fmt Attr PSize PFree /dev/sda3 VG_XenStorage-76d8320a-18bd-1b29-4040-caf0361ce575 lvm2 a-- <1.60t 777.70g /dev/sdb VG_XenStorage-76d8320a-18bd-1b29-4040-caf0361ce575 lvm2 a-- <1.64t <1.64tNIC 1xHP Ethernet 1Gb 4-port 331FLR Adapter (4x1Gbit/s)
- Nic0 = Management
- Nic1 + Nic2 = Bond for VM
- Nic3 = Storage Network for Backup
Actual active VMs 1x Win10 4x vCPU 8GB RAM
1x Win10 4x vCPU 8GB RAM
1x Win10 4x vCPU 16GB RAM
1x Win10 4x vCPU 8GB RAM (temporary fresh installed for testing)
-
@Affonso thanks for this...
doese the cpu boost the frequency on load or is the cpu permanetly on 2,7ghz
-
What's the load average on your Dom0? What's the current resources allocated to it? (vCPUs and memory)? Might be interesting to check also the load on the SR (eg with
iostat -x) -
@high-voltages I believe turbo boost takes it up to 3.3GHz. The 2.7 is reduced workload
-
In guests (even privileded guest like dom0),
/proc/cpuinforeports only what xen exposes to it, it generally is shown as fixed value.You can only get some more insight using
xenpmwhen it actually shows something. I found it commonly having parts working or not depending on the CPU. On a xeon here, I get the same as you withget-cpufreq-parabut you can have a look atget-cpufreq-averagewhich is generally working, here you can see the frequency moving, on an idle machine it should be lower, and get higher with load.Hope this helps.
-
Thanks for the Feedback @ all
I have tested some commands from above and discovered something
a good working host system:
iostat -x
Linux 4.19.0+1 (xcpngautewe)    02/27/2024      _x86_64_        (8 CPU)

avg-cpu:  %user   %nice %system %iowait  %steal   %idle
           0.18    0.00    0.34    0.00    0.07   99.41

Device:         rrqm/s   wrqm/s     r/s     w/s    rkB/s    wkB/s avgrq-sz avgqu-sz   await r_await w_await  svctm  %util
nvme0n1           0.04     0.08    2.02    2.50   135.07   202.56   149.24     0.00    0.30    0.27    0.32   0.21   0.10
sda               0.08     0.81    2.29    3.26   126.80   161.85   104.05     0.00    0.57    0.69    0.48   0.29   0.16
dm-0              0.00     0.00    0.00    0.00     0.47     0.00   244.40     0.00    0.81    0.82    0.00   0.81   0.00
dm-1              0.00     0.00    0.00    0.00     0.33     0.00   215.58     0.00    0.86    0.91    0.04   0.86   0.00
dm-2              0.00     0.00    0.00    0.00     0.00     0.00    21.18     0.00    0.19    0.16    0.23   0.19   0.00
dm-3              0.00     0.00    0.21    0.21    12.58    11.83   117.71     0.00    0.71    0.97    0.46   0.33   0.01
tda               0.00     0.00    0.00    0.00     0.00     0.00    39.09     0.00    0.55    0.55    0.00   0.15   0.00
tdb               0.00     0.00    0.00    0.00     0.00     0.00    39.09     0.00    0.55    0.55    0.00   0.15   0.00
in comparison to the slow host system:
iostat -x
Linux 4.19.0+1 (localhost.localdomain)  02/27/2024      _x86_64_        (16 CPU)

avg-cpu:  %user   %nice %system %iowait  %steal   %idle
           0.29    0.00    0.53    0.02    0.03   99.13

Device:         rrqm/s   wrqm/s     r/s     w/s    rkB/s    wkB/s avgrq-sz avgqu-sz   await r_await w_await  svctm  %util
sda               0.14     0.91    6.54    7.67   308.70   284.24    83.43     0.10    7.15    3.08   10.62   2.96   4.21
sdb               0.00     0.00    0.01    0.00     1.33     0.00   254.01     0.00    1.61    1.61    7.25   1.60   0.00
dm-0              0.00     0.00    0.00    0.00     0.54     0.00   253.31     0.00    1.78    1.73   34.50   1.76   0.00
dm-5              0.00     0.00    0.20    0.17    20.11     2.27   119.98     0.00    4.71    0.91    9.28   2.41   0.09
tdc               0.00     0.00    0.00    0.00     0.04     0.00    81.29     0.00   27.58   27.58    0.00   7.40   0.00
sdc               0.00     0.00    0.01    0.00     0.53     0.00   126.86     0.00    4.08    4.08    0.00   2.24   0.00
dm-1              0.00     0.00    1.26    1.76    49.67    39.38    59.01     0.02    5.22    2.67    7.05   4.00   1.21
dm-2              0.00     0.00    0.12    0.14    21.73    24.61   345.21     0.00    9.35    4.45   13.56   3.18   0.09
dm-3              0.00     0.00    0.11    0.00     2.20     0.00    41.97     0.00    0.97    0.97    0.00   0.84   0.01
dm-4              0.00     0.00    0.27    0.00    12.30     0.00    90.10     0.00    3.15    3.15    0.00   2.56   0.07
tda               0.00     0.00    0.00    0.00     0.00     0.00    39.09     0.00    2.42    2.42    0.00   1.28   0.00
tdb               0.00     0.00    0.00    0.00     0.00     0.00    39.09     0.00    0.60    0.60    0.00   0.23   0.00
dm-6              0.00     0.00    0.11    0.10     5.00     4.04    87.11     0.00    6.31    2.74   10.09   3.63   0.08
tdd               0.00     0.00    0.00    0.00     0.00     0.00    39.09     0.00    0.53    0.53    0.00   0.38   0.00
dm-7              0.00     0.00    0.04    0.00     1.96     0.04    88.39     0.00    4.69    4.02   15.47   3.11   0.01
tde               0.00     0.00    0.00    0.00     0.00     0.00    39.09     0.00    0.57    0.57    0.00   0.38   0.00
dm-8              0.00     0.00    0.00    0.00     0.00     0.00    45.15     0.00   11.98    7.87   20.20  10.80   0.00
dm-9              0.00     0.00    0.00    0.00     0.00     0.00    38.85     0.00   12.60    6.04   23.95  11.96   0.00
dm-10             0.00     0.00    0.07    0.04     1.97     1.26    58.93     0.00   10.88    7.96   15.34   2.78   0.03
dm-11             0.00     0.00    0.00    0.00     0.00     0.00    28.84     0.00   12.16   12.16    0.00   7.12   0.00
dm-12             0.00     0.00    0.00    0.00     0.00     0.00    41.06     0.00   10.25   10.25    0.00   6.90   0.00
dm-13             0.00     0.00    0.00    0.00     0.00     0.00    54.52     0.00    5.10    5.10    0.00   5.02   0.00
dm-14             0.00     0.00    0.04    0.00     1.36     0.00    67.46     0.00    4.38    4.38    0.00   2.27   0.01
dm-15             0.00     0.00    0.01    0.00     0.12     0.00    48.19     0.00    7.59    7.59    0.00   6.14   0.00
tdf               0.00     0.00    0.00    0.00     0.00     0.00    39.09     0.00   48.68   48.68    0.00   7.17   0.00
tdg               0.00     0.00    0.00    0.00     0.00     0.00    39.09     0.00   30.45   30.45    0.00   4.98   0.00
tdh               0.00     0.00    0.00    0.00     0.00     0.00    39.09     0.00    1.45    1.45    0.00   0.60   0.00
the columns with the wait timings are much higher than the from the fast host
that’s very strange from my point of view.further the CPU stat does not shows correct values because the fast host was at the time of the command under heavy load with about 80%.
on the slow was some load but there the CPU is much stronger
@bleader: the comand "get-cpufreq-average" gives no output at all.
-
@high-voltages so nothing there hints you to a problem with the drive SDA on the slow "host"?
-
@high-voltages you also can try
xenpm start 10to gather info for 10s and it will print a sumarry at the end, in my case it had each core average frequency, not sure you'll get it too, but you can give it a shot.
Hello! It looks like you're interested in this conversation, but you don't have an account yet.
Getting fed up of having to scroll through the same posts each visit? When you register for an account, you'll always come back to exactly where you were before, and choose to be notified of new replies (either via email, or push notification). You'll also be able to save bookmarks and upvote posts to show your appreciation to other community members.
With your input, this post could be even better 💗
Register Login