DRBD reactor metrics in k8s
-
Hello! I set this up and thought I would share, as it gave me a question I wanted to ask.
First the setup.
For each of our xcp-ng hosts (5 for this cluster) I setup the following.cat <<EOF > /etc/drbd-reactor.d/prometheus.toml [[prometheus]] enums = true address = "10.2.0.1[0-4]:9942" EOF systemctl restart drbd-reactor nano /etc/sysconfig/iptables #add -A RH-Firewall-1-INPUT -s 10.1.8.0/22 -p tcp -m conntrack --ctstate NEW -m tcp --dport 9942 -j ACCEPT -A RH-Firewall-1-INPUT -s 10.1.8.0/22 -p tcp -m conntrack --ctstate NEW -m tcp --dport 9100 -j ACCEPT systemctl restart iptables wget https://github.com/prometheus/node_exporter/releases/download/v1.12.1/node_exporter-1.12.1.linux-amd64.tar.gz tar xvfz node_exporter-*.linux-amd64.tar.gz mv node_exporter-*.linux-amd64/node_exporter /usr/local/bin/ cat <<EOF > /etc/systemd/system/node_exporter.service [Unit] Description=Node Exporter After=network.target [Service] User=root ExecStart=/usr/local/bin/node_exporter --web.listen-address=10.2.0.1[0-4]:9100 [Install] WantedBy=multi-user.target EOF systemctl daemon-reload systemctl enable --now node_exporterThen because I wanted to reuse my existing setup, I deployed the following in k8s in a new namespace for organization.
---
apiVersion: v1
kind: Endpoints
metadata:
  name: xcp-ng-metrics
  namespace: xcp-ng-monitoring
subsets:
  - addresses:
      - ip: 10.2.0.10
      - ip: 10.2.0.11
      - ip: 10.2.0.12
      - ip: 10.2.0.13
      - ip: 10.2.0.14
    ports:
      - name: drbd
        port: 9942
        protocol: TCP
      - name: node
        port: 9100
        protocol: TCP
---
apiVersion: v1
kind: Service
metadata:
  name: xcp-ng-metrics
  namespace: xcp-ng-monitoring
  labels:
    app: xcp-ng-metrics
spec:
  clusterIP: None
  ports:
    - name: drbd
      port: 9942
      targetPort: 9942
    - name: node
      port: 9100
      targetPort: 9100
---
apiVersion: monitoring.coreos.com/v1
kind: ServiceMonitor
metadata:
  name: xcp-ng
  namespace: xcp-ng-monitoring
spec:
  selector:
    matchLabels:
      app: xcp-ng-metrics
  endpoints:
    - port: drbd
      interval: 30s
    - port: node
      interval: 30s
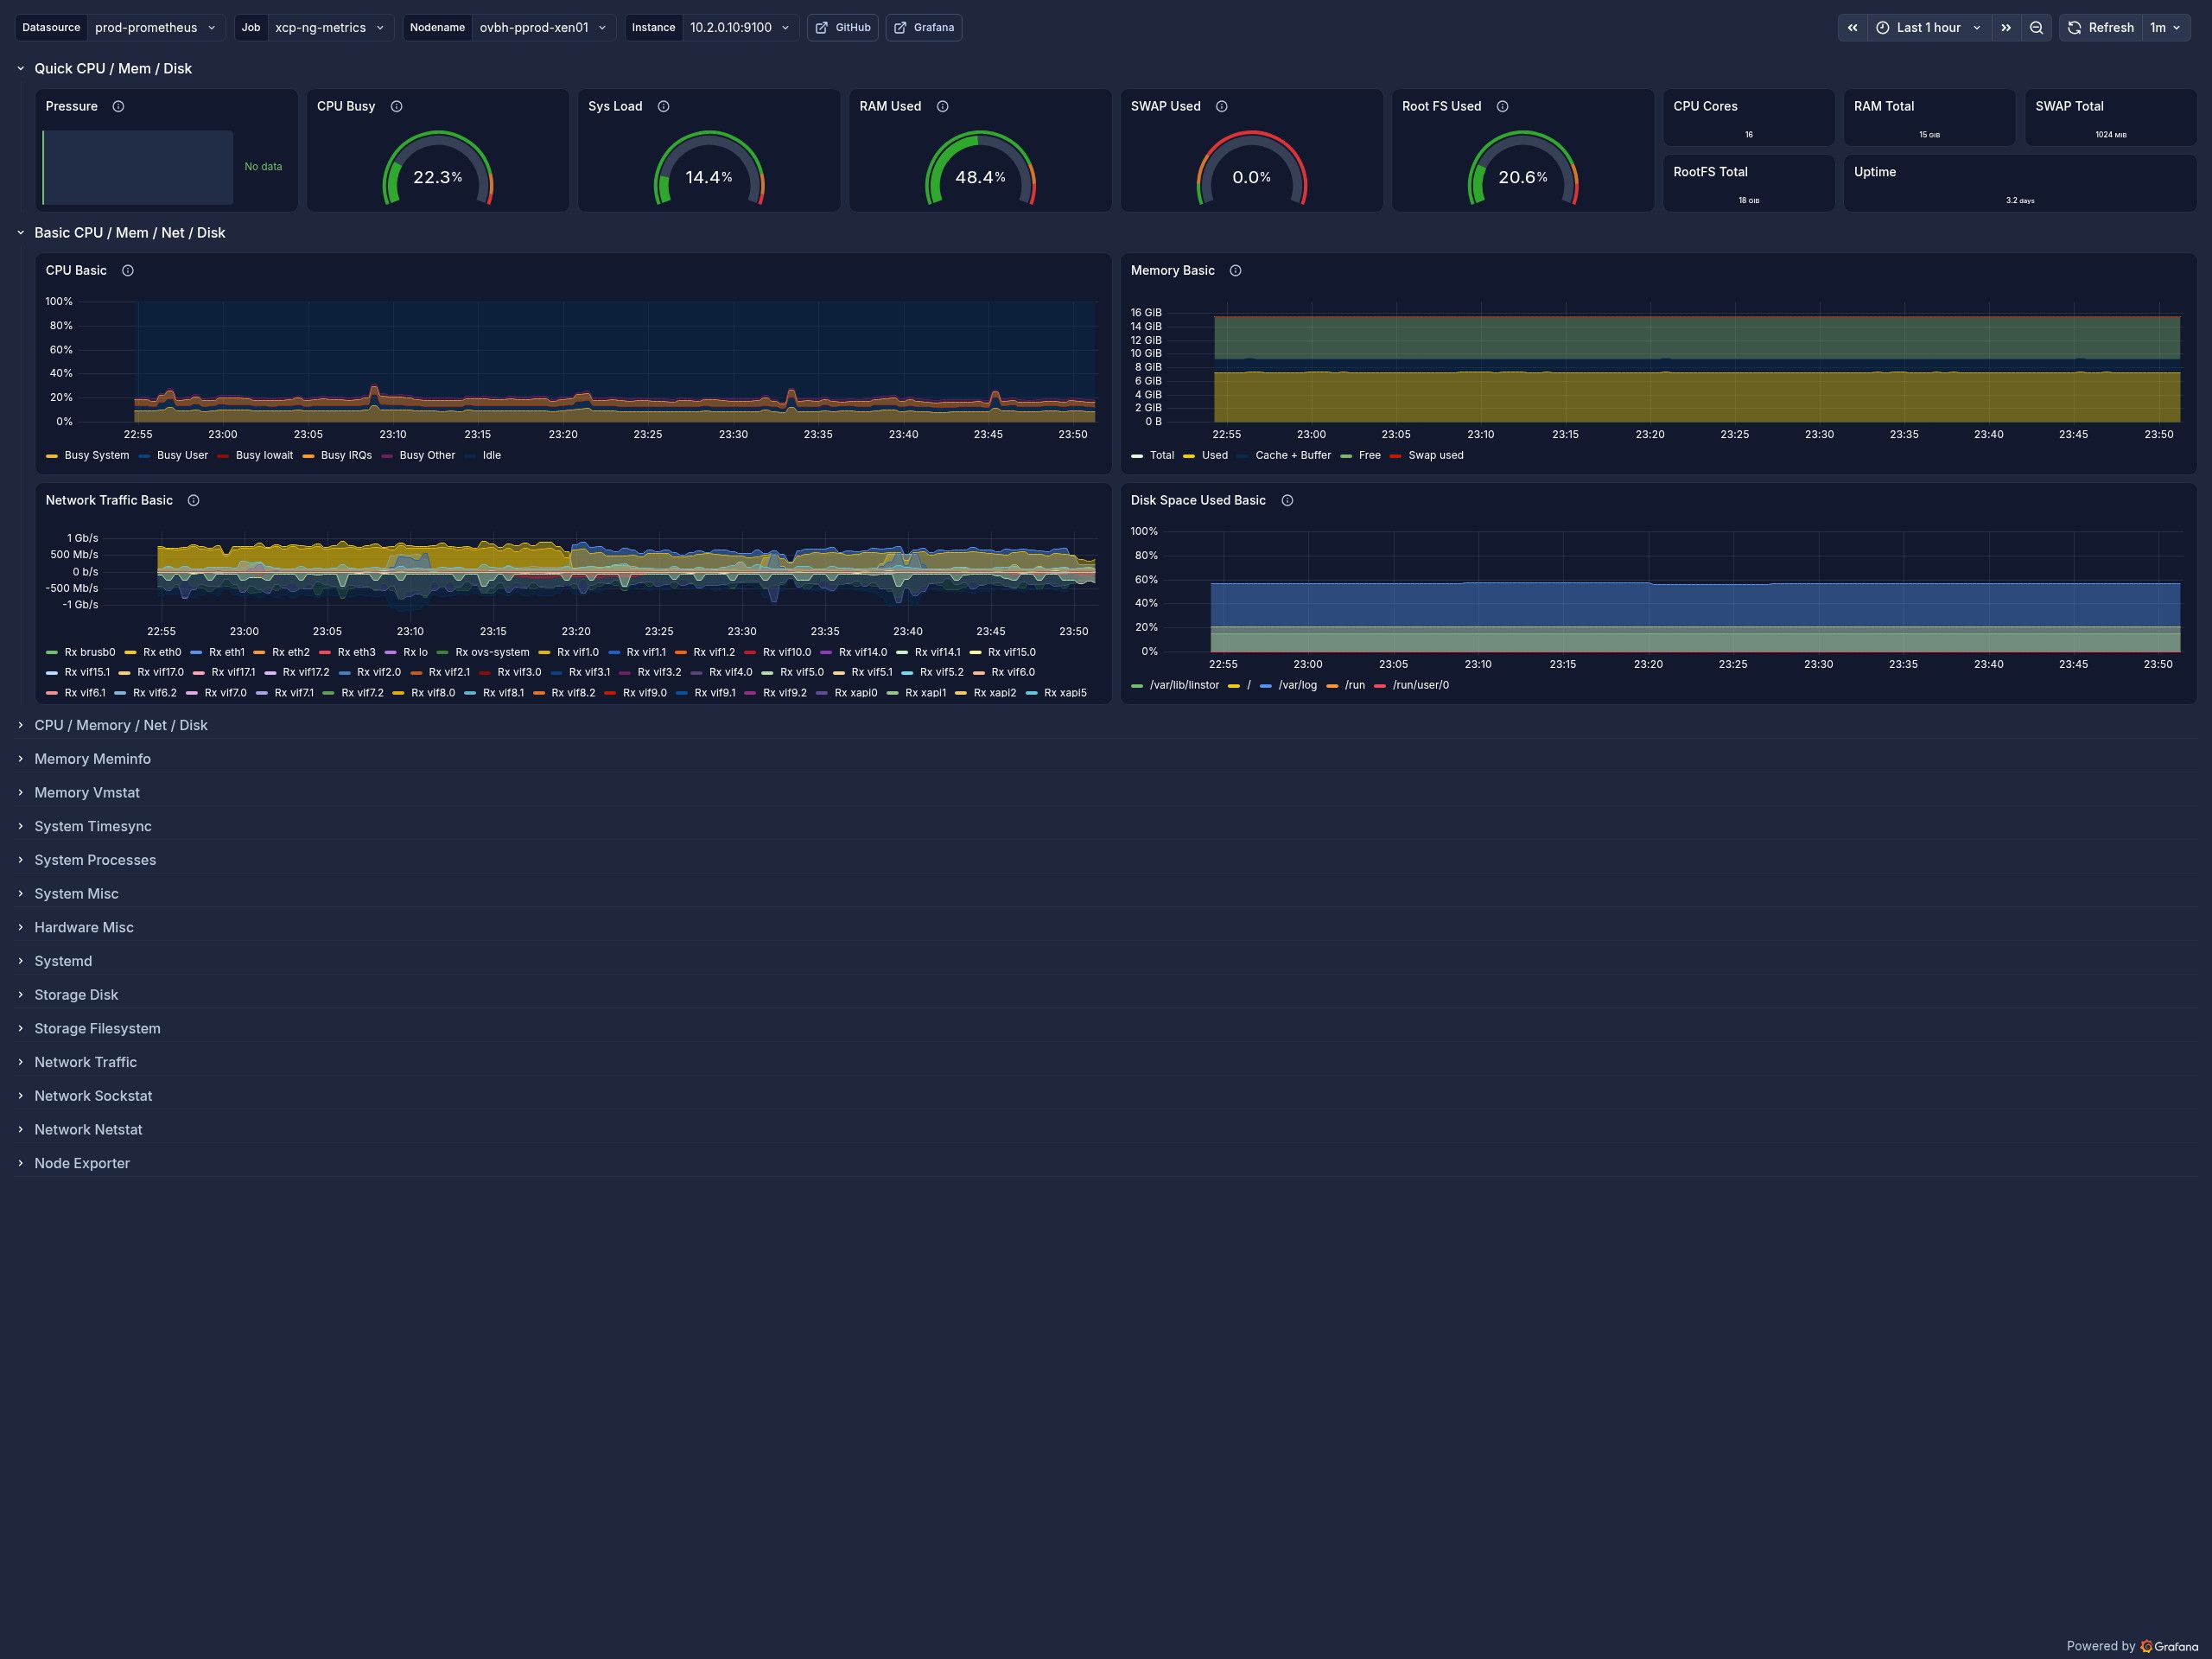
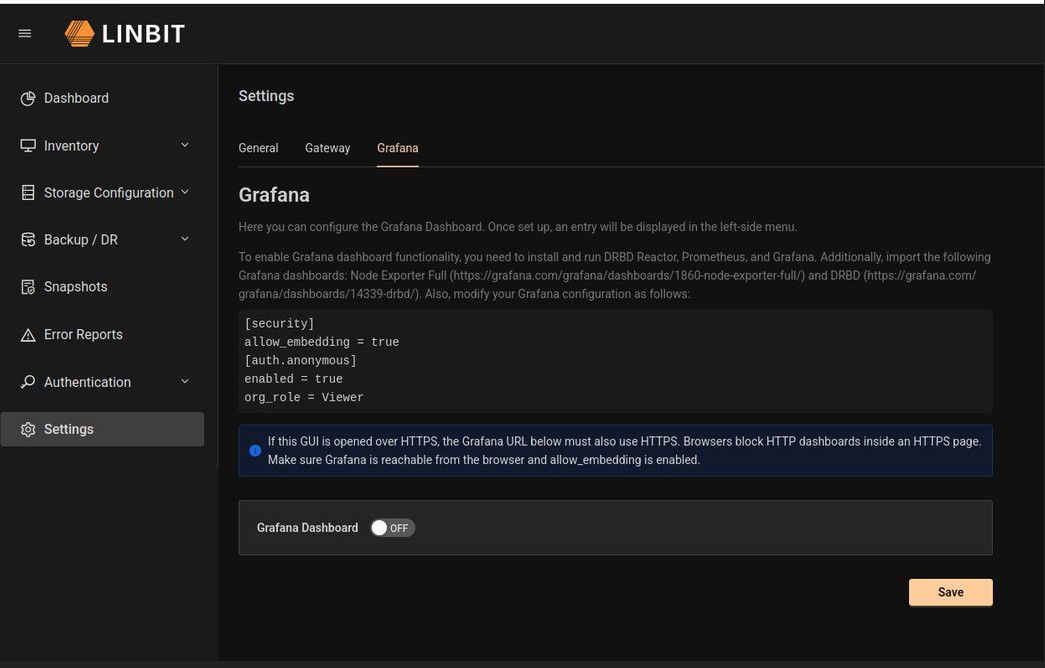
Then I went and nabbed these two dashboards linked in the GUI
Node-exporter is as expected
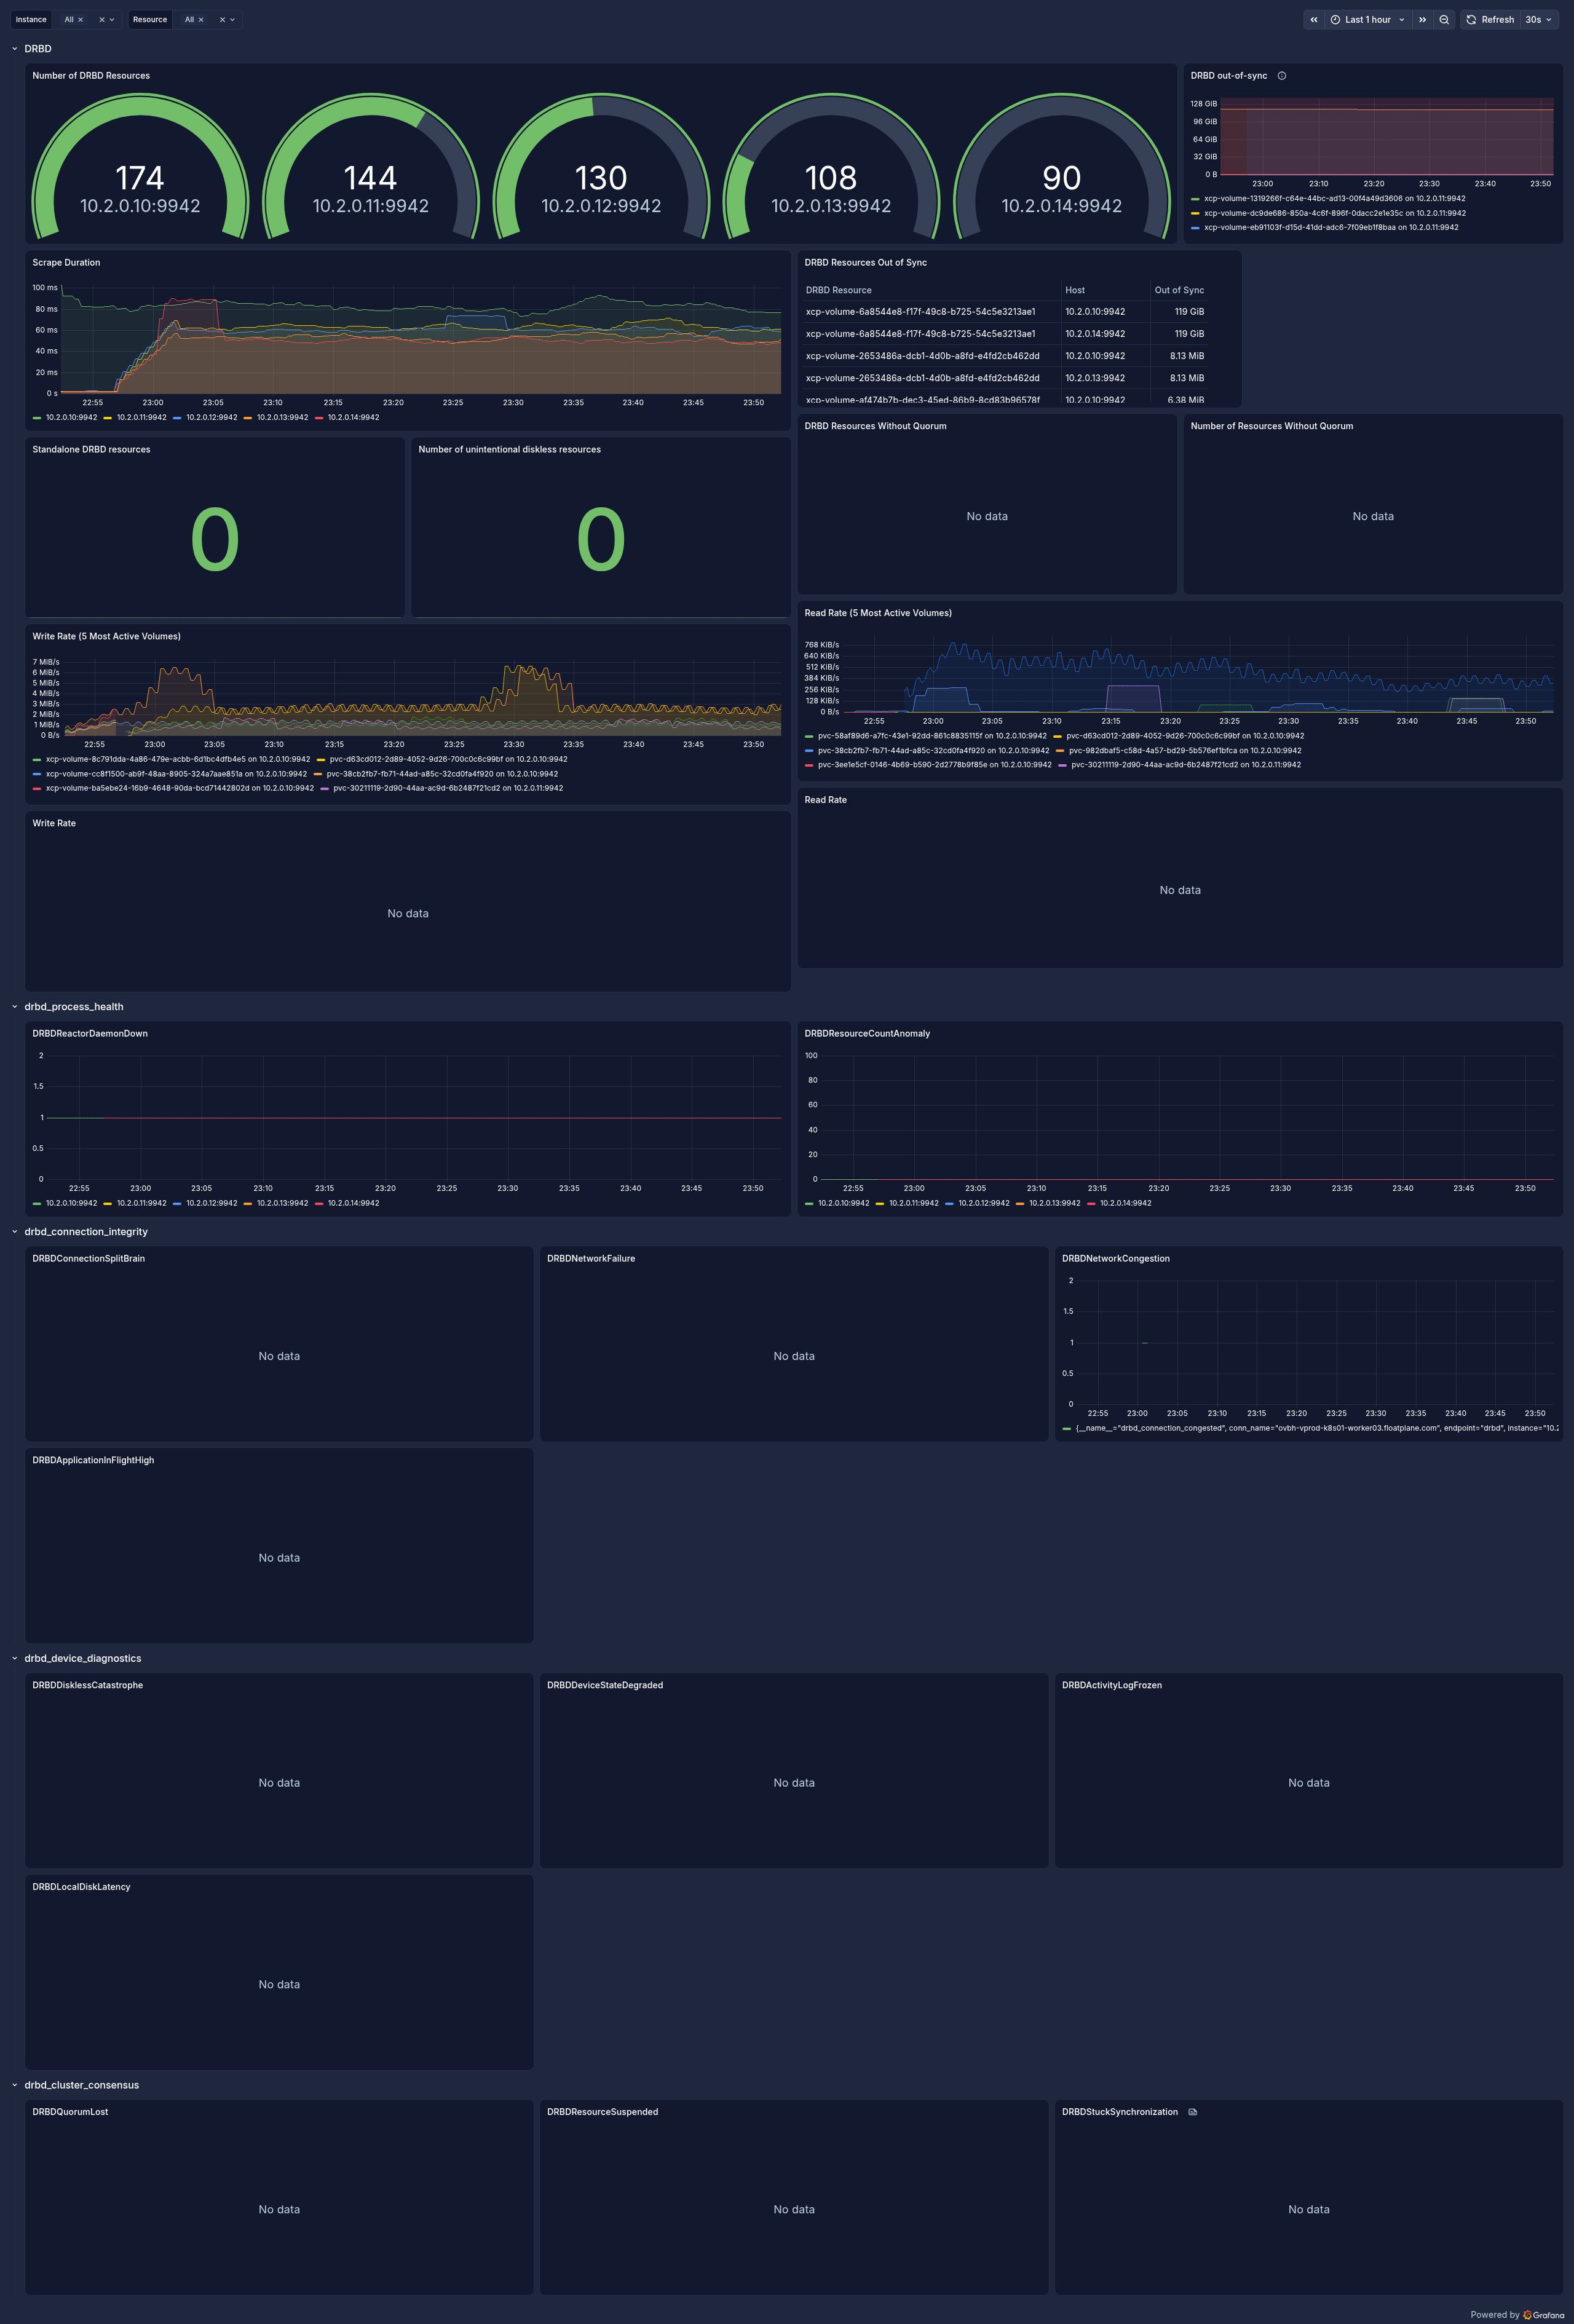
I have already built out the DRBD reactor dashboard, cause I want to spec out some prometheus rules.
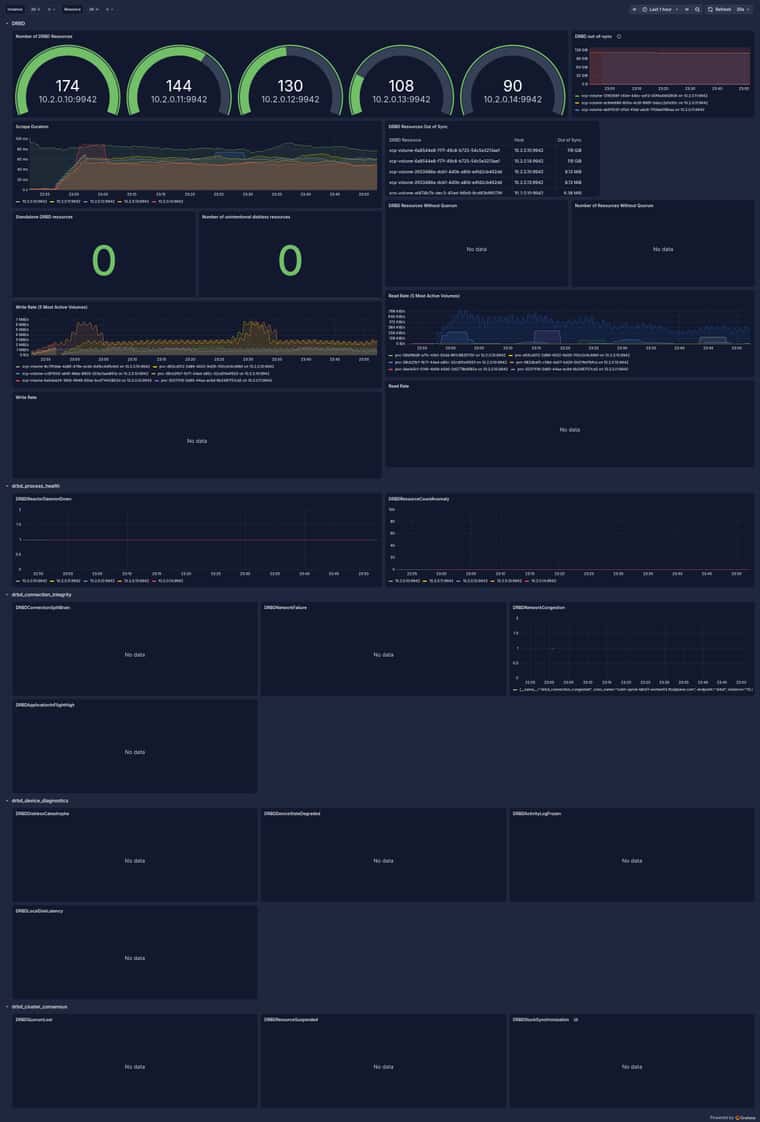
Possible prometheus rules for alerting, gotten by taking https://github.com/LINBIT/drbd-reactor/blob/master/doc/prometheus.md and feeding it into an llm. Then going over each one and created a panel for it and tinkered to ensure it functioned as desired. A few generated were nonsense but that is how it goes lol.
--- apiVersion: monitoring.coreos.com/v1 kind: PrometheusRule metadata: name: xcp-ng-metrics-rules namespace: xcp-ng-monitoring spec: groups: - name: drbd_process_health rules: - alert: DRBDReactorDaemonDown expr: drbdreactor_up == 0 or up{job="drbd-reactor"} == 0 for: 1m labels: severity: critical annotations: summary: "DRBD Reactor telemetry agent is unreachable on {{ $labels.instance }}" description: "The DRBD Prometheus endpoint has failed. Metrics for this node are stale, blinding the cluster manager to storage faults." - alert: DRBDResourceCountAnomaly expr: changes(drbd_resource_resources[15m]) > 0 for: 5m labels: severity: warning annotations: summary: "DRBD resource count fluctuated on {{ $labels.instance }}" description: "The number of active DRBD resources has changed unexpectedly. Verify that no resources were erroneously deleted or unconfigured." - name: drbd_connection_integrity rules: - alert: DRBDConnectionSplitBrain expr: drbd_connection_state{drbd_connection_state="StandAlone"} == 1 for: 1m labels: severity: critical annotations: summary: "DRBD Split-Brain detected on {{ $labels.instance }} (StandAlone State)" description: "The DRBD resource has entered the StandAlone state, refusing to reconnect. This signifies failed authentication, manual disconnection, or an active split-brain partition." - alert: DRBDNetworkFailure expr: drbd_connection_state{drbd_connection_state="NetworkFailure"} == 1 or drbd_connection_state{drbd_connection_state="BrokenPipe"} == 1 for: 2m labels: severity: critical annotations: summary: "DRBD peer connection lost on {{ $labels.instance }}" description: "The TCP/IP connection to the DRBD peer has been severed. Replication is currently halted." - alert: DRBDNetworkCongestion expr: drbd_connection_congested == 1 for: 10m labels: severity: warning annotations: summary: "TCP Send Buffer saturated on {{ $labels.instance }}" description: "The DRBD connection's TCP send buffer has remained over 80% full for 10 minutes, indicating systemic network bandwidth exhaustion." - alert: DRBDApplicationInFlightHigh expr: drbd_connection_apinflight_bytes > 536870912 # 500 MB for: 5m labels: severity: warning annotations: summary: "Excessive unacknowledged application I/O on {{ $labels.instance }}" description: "Over 500MB of application data is in flight to the peer. The peer storage or network link is severely bottlenecking synchronous replication." - name: drbd_device_diagnostics rules: - alert: DRBDDisklessCatastrophe expr: drbd_device_unintentionaldiskless == 1 and drbd_device_client == 0 for: 30s labels: severity: critical annotations: summary: "DRBD physical backing device failed on {{ $labels.instance }}" description: "The underlying storage device has suffered an I/O fault and detached. The node is operating in a failed diskless state." - alert: DRBDDeviceStateDegraded expr: drbd_device_state{drbd_device_state="Failed"} == 1 or drbd_device_state{drbd_device_state="Inconsistent"} == 1 for: 5m labels: severity: critical annotations: summary: "DRBD local disk state is degraded on {{ $labels.instance }}" description: "The local block device is marked as {{ $labels.drbd_device_state }}. Data redundancy is compromised." - alert: DRBDActivityLogFrozen expr: drbd_device_alsuspended == 1 for: 1m labels: severity: critical annotations: summary: "DRBD metadata Activity Log suspended on {{ $labels.instance }}" description: "The metadata sector is unwritable, suspending the Activity Log. All application writes are blocked to prevent corruption." - alert: DRBDLocalDiskLatency expr: drbd_device_lowerpending > 1000 and drbd_device_upperpending > 1000 for: 3m labels: severity: warning annotations: summary: "Severe local disk latency on {{ $labels.instance }}" description: "Over 1000 requests are queued from DRBD to the local block layer, causing upstream application I/O to stall." - name: drbd_cluster_consensus rules: - alert: DRBDQuorumLost expr: drbd_device_quorum == 0 for: 15s labels: severity: critical annotations: summary: "DRBD Quorum lost for resource on {{ $labels.instance }}" description: "The node has lost contact with the cluster majority. To prevent split-brain data corruption, the volume has likely suspended I/O." - alert: DRBDResourceSuspended expr: drbd_resource_suspended == 1 for: 1m labels: severity: critical annotations: summary: "DRBD Resource is fully suspended on {{ $labels.instance }}" description: "All read and write system calls are blocked. Applications utilizing this block device will hang in D-state." - alert: DRBDStuckSynchronization expr: drbd_peerdevice_outofsync_bytes > 0 and rate(drbd_connection_rsinflight_bytes[5m]) == 0 for: 15m labels: severity: critical annotations: summary: "DRBD background synchronization is stalled on {{ $labels.instance }}" description: "Data divergence exists between peers ({{ $value }} bytes), but no resynchronization traffic has been detected for 5 minutes." -
Now for my question that I would love input on. This DRBD dashboard states that there are some things out of sync.
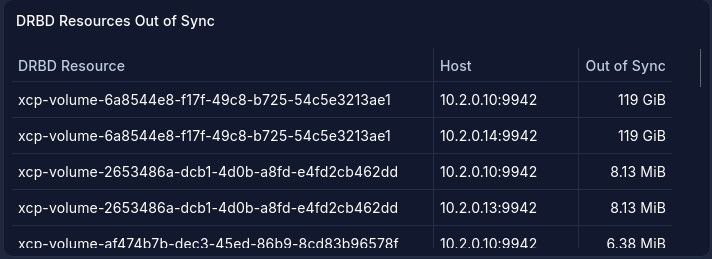
Which is fed from this metric

However linstor says differently.
jonathon@jonathon-framework:~$ linstor --controllers=10.2.0.10,10.2.0.11,10.2.0.12,10.2.0.13,10.2.0.14 r l | grep xcp-volume-6a8544e8-f17f-49c8-b725-54c5e3213ae1
│ xcp-volume-6a8544e8-f17f-49c8-b725-54c5e3213ae1 │ ovbh-pprod-xen01                         │ DRBD,STORAGE │ Unused │ Ok    │ UpToDate │ Yes  │
│ xcp-volume-6a8544e8-f17f-49c8-b725-54c5e3213ae1 │ ovbh-pprod-xen02                         │ DRBD,STORAGE │ InUse  │ Ok    │ UpToDate │ Yes  │
│ xcp-volume-6a8544e8-f17f-49c8-b725-54c5e3213ae1 │ ovbh-pprod-xen05                         │ DRBD,STORAGE │ Unused │ Ok    │ UpToDate │ Yes  │
jonathon@jonathon-framework:~$ linstor --controllers=10.2.0.10,10.2.0.11,10.2.0.12,10.2.0.13,10.2.0.14 v l | grep xcp-volume-6a8544e8-f17f-49c8-b725-54c5e3213ae1
│ xcp-volume-6a8544e8-f17f-49c8-b725-54c5e3213ae1 │ ovbh-pprod-xen01                         │ xcp-sr-linstor_group_thin_device │     0 │    1013 │ /dev/drbd1013 │ 300.26 GiB │ Unused │ UpToDate │ Established(2) │
│ xcp-volume-6a8544e8-f17f-49c8-b725-54c5e3213ae1 │ ovbh-pprod-xen02                         │ xcp-sr-linstor_group_thin_device │     0 │    1013 │ /dev/drbd1013 │ 300.26 GiB │ InUse  │ UpToDate │ Established(2) │
│ xcp-volume-6a8544e8-f17f-49c8-b725-54c5e3213ae1 │ ovbh-pprod-xen05                         │ xcp-sr-linstor_group_thin_device │     0 │    1013 │ /dev/drbd1013 │ 300.26 GiB │ Unused │ UpToDate │ Established(2) │
What is this pv? K8s worker vdi. Cool
jonathon@jonathon-framework:~$ linstor --controllers=10.2.0.10,10.2.0.11,10.2.0.12,10.2.0.13,10.2.0.14 kv s xcp-sr-linstor_group_thin_device | grep d07a41d6-0aa2-49a5-a241-b755c6daa3d8
│ xcp/volume/d07a41d6-0aa2-49a5-a241-b755c6daa3d8/metadata    │ {"name_label": "OVBH-VPROD-K8S01-WORKER02", "name_description": "", "is_a_snapshot": false, "snapshot_of": "", "snapshot_time": "", "type": "user", "vdi_type": "vhd", "read_only": false, "metadata_of_pool": ""}                                         │
│ xcp/volume/d07a41d6-0aa2-49a5-a241-b755c6daa3d8/not-exists  │ 0                                                                                                                                                                                                                                                          │
│ xcp/volume/d07a41d6-0aa2-49a5-a241-b755c6daa3d8/volume-name │ xcp-volume-6a8544e8-f17f-49c8-b725-54c5e3213ae1                                                                                                                                                                                                            │
I notice it only states that some
xcp-volumes-*are out of sync, and none of the pvs created by piraeus operator.Curious to know if anyone has any thoughts on this?
-
From LINBIT's description,
drbd_peerdevice_outofsync_bytesis what one node's bitmap says is still out of sync with one particular peer, while the UpToDate inlinstor r lis the state of each node's own disk, so as far as I understand the two aren't measuring the same thing (the resource states are described at https://docs.xcp-ng.org/xostor#drbdlinstor-resource-state).Your table has the 119 GiB on .10 and .14, the two Unused copies, so I'd be curious which peer those series point at; the labels on the metric should say. If I'm reading drbd-utils right,
drbdsetup status xcp-volume-6a8544e8-f17f-49c8-b725-54c5e3213ae1 --verbose --statisticson xen01 also prints an out-of-sync figure per peer, but I haven't got an XOSTOR cluster to try it on, so treat that as a (not so educated) guess.Whether a non-zero number between two secondaries means anything is beyond me; @Team-Storage will know.
-
hmm
primary, xen02
[13:30 ovbh-pprod-xen02 ~]# drbdsetup status xcp-volume-6a8544e8-f17f-49c8-b725-54c5e3213ae1 --verbose --statistics
xcp-volume-6a8544e8-f17f-49c8-b725-54c5e3213ae1 node-id:1 role:Primary suspended:no force-io-failures:no
    write-ordering:flush
  volume:0 minor:1013 disk:UpToDate backing_dev:/dev/linstor_group/xcp-volume-6a8544e8-f17f-49c8-b725-54c5e3213ae1_00000 quorum:yes open:yes
      size:315195168 read:233813750 written:1173974506 al-writes:758189 bm-writes:361 upper-pending:0 lower-pending:0 al-suspended:no blocked:no
  ovbh-pprod-xen01 node-id:0 connection:Connected role:Secondary tls:no congested:no ap-in-flight:0 rs-in-flight:0
    volume:0 replication:Established peer-disk:UpToDate resync-suspended:no
        received:0 sent:1173974894 out-of-sync:0 pending:1 unacked:0
  ovbh-pprod-xen05 node-id:2 connection:Connected role:Secondary tls:no congested:no ap-in-flight:0 rs-in-flight:0
    volume:0 replication:Established peer-disk:UpToDate resync-suspended:no
        received:0 sent:1146927724 out-of-sync:0 pending:1 unacked:0
xen01
[13:31 ovbh-pprod-xen01 ~]# drbdsetup status xcp-volume-6a8544e8-f17f-49c8-b725-54c5e3213ae1 --verbose --statistics xcp-volume-6a8544e8-f17f-49c8-b725-54c5e3213ae1 node-id:0 role:Secondary suspended:no force-io-failures:no write-ordering:flush volume:0 minor:1013 disk:UpToDate backing_dev:/dev/linstor_group/xcp-volume-6a8544e8-f17f-49c8-b725-54c5e3213ae1_00000 quorum:yes open:no size:315195168 read:1242 written:1181073258 al-writes:819172 bm-writes:349703 upper-pending:0 lower-pending:0 al-suspended:no blocked:no ovbh-pprod-xen02 node-id:1 connection:Connected role:Primary tls:no congested:no ap-in-flight:0 rs-in-flight:0 volume:0 replication:Established peer-disk:UpToDate resync-suspended:no received:1174048714 sent:0 out-of-sync:0 pending:0 unacked:0 ovbh-pprod-xen05 node-id:2 connection:Connected role:Secondary tls:no congested:no ap-in-flight:0 rs-in-flight:0 volume:0 replication:Established peer-disk:UpToDate resync-suspended:no received:0 sent:0 out-of-sync:111291800 pending:0 unacked:0 -
Wonder if these are just issues that will be fixed and not come back by manually cleaning it up. Held off at first cause I did not want to manually clean up, and then have it happen again.
Will post in a bit when it finishes and will monitor this one for a few.
[18:45 ovbh-pprod-xen02 ~]# drbdadm status xcp-volume-6a8544e8-f17f-49c8-b725-54c5e3213ae1 --verbose --statistics
drbdsetup status xcp-volume-6a8544e8-f17f-49c8-b725-54c5e3213ae1 --verbose --statistics
xcp-volume-6a8544e8-f17f-49c8-b725-54c5e3213ae1 node-id:1 role:Primary suspended:no force-io-failures:no
    write-ordering:flush
  volume:0 minor:1013 disk:UpToDate backing_dev:/dev/linstor_group/xcp-volume-6a8544e8-f17f-49c8-b725-54c5e3213ae1_00000 quorum:yes open:yes
      size:315195168 read:296465702 written:1319196709 al-writes:790653 bm-writes:361 upper-pending:1 lower-pending:1 al-suspended:no blocked:no
  ovbh-pprod-xen01 node-id:0 connection:Connected role:Secondary tls:no congested:no ap-in-flight:0 rs-in-flight:0
    volume:0 replication:Established peer-disk:UpToDate resync-suspended:no
        received:0 sent:1319197101 out-of-sync:0 pending:1 unacked:0
  ovbh-pprod-xen05 node-id:2 connection:Connected role:Secondary tls:no congested:no ap-in-flight:8 rs-in-flight:0
    volume:0 replication:Established peer-disk:UpToDate resync-suspended:no
        received:0 sent:1292149931 out-of-sync:0 pending:1 unacked:0

[18:45 ovbh-pprod-xen02 ~]# drbdadm invalidate-remote xcp-volume-6a8544e8-f17f-49c8-b725-54c5e3213ae1
[18:45 ovbh-pprod-xen02 ~]# drbdadm status xcp-volume-6a8544e8-f17f-49c8-b725-54c5e3213ae1 --verbose --statistics
drbdsetup status xcp-volume-6a8544e8-f17f-49c8-b725-54c5e3213ae1 --verbose --statistics
xcp-volume-6a8544e8-f17f-49c8-b725-54c5e3213ae1 node-id:1 role:Primary suspended:no force-io-failures:no
    write-ordering:flush
  volume:0 minor:1013 disk:UpToDate backing_dev:/dev/linstor_group/xcp-volume-6a8544e8-f17f-49c8-b725-54c5e3213ae1_00000 quorum:yes open:yes
      size:315195168 read:300587646 written:1319298558 al-writes:790664 bm-writes:15389 upper-pending:0 lower-pending:1 al-suspended:no blocked:no
  ovbh-pprod-xen01 node-id:0 connection:Connected role:Secondary tls:no congested:no ap-in-flight:0 rs-in-flight:0
    volume:0 replication:SyncSource peer-disk:Inconsistent done:0.69 resync-suspended:no
        received:0 sent:1321387882 out-of-sync:313023380 pending:0 unacked:1 dbdt1:35.66 eta:8573
  ovbh-pprod-xen05 node-id:2 connection:Connected role:Secondary tls:no congested:no ap-in-flight:0 rs-in-flight:0
    volume:0 replication:SyncSource peer-disk:Inconsistent done:0.65 resync-suspended:no
        received:0 sent:1294222956 out-of-sync:313141144 pending:0 unacked:0 dbdt1:30.42 eta:10052
jonathon@jonathon-framework:~$ linstor --controllers=10.2.0.10,10.2.0.11,10.2.0.12,10.2.0.13,10.2.0.14 r l | grep xcp-volume-6a8544e8-f17f-49c8-b725-54c5e3213ae1 │ xcp-volume-6a8544e8-f17f-49c8-b725-54c5e3213ae1 │ ovbh-pprod-xen01 │ DRBD,STORAGE │ Unused │ Ok │ UpToDate │ Yes │ │ xcp-volume-6a8544e8-f17f-49c8-b725-54c5e3213ae1 │ ovbh-pprod-xen02 │ DRBD,STORAGE │ InUse │ Ok │ UpToDate │ Yes │ │ xcp-volume-6a8544e8-f17f-49c8-b725-54c5e3213ae1 │ ovbh-pprod-xen05 │ DRBD,STORAGE │ Unused │ Ok │ UpToDate │ Yes │ jonathon@jonathon-framework:~$ linstor --controllers=10.2.0.10,10.2.0.11,10.2.0.12,10.2.0.13,10.2.0.14 r l | grep xcp-volume-6a8544e8-f17f-49c8-b725-54c5e3213ae1 │ xcp-volume-6a8544e8-f17f-49c8-b725-54c5e3213ae1 │ ovbh-pprod-xen01 │ DRBD,STORAGE │ Unused │ Ok │ SyncTarget(0.04%) │ Yes │ │ xcp-volume-6a8544e8-f17f-49c8-b725-54c5e3213ae1 │ ovbh-pprod-xen02 │ DRBD,STORAGE │ InUse │ Ok │ UpToDate │ Yes │ │ xcp-volume-6a8544e8-f17f-49c8-b725-54c5e3213ae1 │ ovbh-pprod-xen05 │ DRBD,STORAGE │ Unused │ Ok │ Inconsistent │ Yes │ jonathon@jonathon-framework:~$ linstor --controllers=10.2.0.10,10.2.0.11,10.2.0.12,10.2.0.13,10.2.0.14 r l | grep xcp-volume-6a8544e8-f17f-49c8-b725-54c5e3213ae1 │ xcp-volume-6a8544e8-f17f-49c8-b725-54c5e3213ae1 │ ovbh-pprod-xen01 │ DRBD,STORAGE │ Unused │ Ok │ SyncTarget(0.64%) │ Yes │ │ xcp-volume-6a8544e8-f17f-49c8-b725-54c5e3213ae1 │ ovbh-pprod-xen02 │ DRBD,STORAGE │ InUse │ Ok │ UpToDate │ Yes │ │ xcp-volume-6a8544e8-f17f-49c8-b725-54c5e3213ae1 │ ovbh-pprod-xen05 │ DRBD,STORAGE │ Unused │ Ok │ SyncTarget(0.61%) │ Yes │ jonathon@jonathon-framework:~$ linstor --controllers=10.2.0.10,10.2.0.11,10.2.0.12,10.2.0.13,10.2.0.14 r l | grep xcp-volume-6a8544e8-f17f-49c8-b725-54c5e3213ae1 │ xcp-volume-6a8544e8-f17f-49c8-b725-54c5e3213ae1 │ ovbh-pprod-xen01 │ DRBD,STORAGE │ Unused │ Ok │ SyncTarget(1.00%) │ Yes │ │ xcp-volume-6a8544e8-f17f-49c8-b725-54c5e3213ae1 │ ovbh-pprod-xen02 │ DRBD,STORAGE │ InUse │ Ok │ UpToDate │ Yes │ │ xcp-volume-6a8544e8-f17f-49c8-b725-54c5e3213ae1 │ ovbh-pprod-xen05 │ DRBD,STORAGE │ Unused │ Ok │ SyncTarget(0.96%) │ Yes │ -
@Jonathon if I read your xen02 output right, from before the resync it already had 0 out of sync towards both other nodes, so the big number only ever lived between xen01 and xen05.

After
invalidate-remoteboth of them are copying fully from xen02 (that's theSyncSourceandInconsistentlines in your last post).I don't know whether that secondary-to-secondary figure comes back on its own once the resync is done.
If it does, the date it reappears and roughly what that k8s worker was doing at the time are probably what @Team-Storage would want to see. I'm curious too, so please do post how it looks after a few days. -
@poddingue Turns out it is all secondary-to-secondary out of sync. So that makes it less intense, though if primary dies I wonder how it will resolve this, or if it will become split brained. Still unsure of how it happened, but the ones I manually cleaned up have not come back. Going to continue to manually clear them up. If it happens again I will have an alert setup to notify me, and I have all the xcp-ng logs and everything to be able to see what happened.
If that happens I will post here with details and logs for the resource so we can see how it occurs.

Hello! It looks like you're interested in this conversation, but you don't have an account yet.
Getting fed up of having to scroll through the same posts each visit? When you register for an account, you'll always come back to exactly where you were before, and choose to be notified of new replies (either via email, or push notification). You'll also be able to save bookmarks and upvote posts to show your appreciation to other community members.
With your input, this post could be even better 💗
Register Login