How to control AMD GPU?
-
Hello!
Is there any tool to control and monitor AMD GPUs?
I'm experimenting with FirePro S7150x2 installed in supermicro AS -2024US-TRT.
I have installed XCP-ng 8.2.1 + AMD MxGPU extension.
XCP-ng with latest updates.
Everything was fine until today.On previous days I could create and plug vGPUs to VMs and it worked.
There was only one issue - VMs stuck on shutdown with such an error
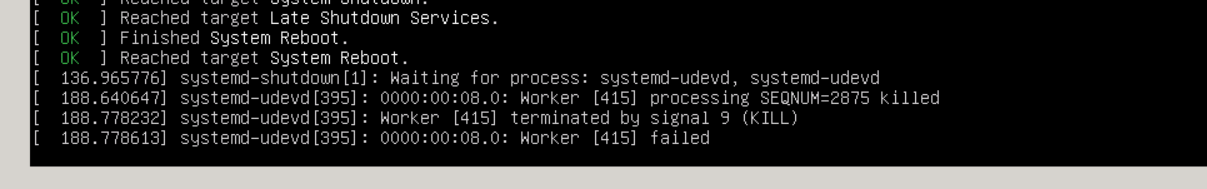
In this situations I used hard shutdown.
I have been working on fixing this issue in my templates.After few days of experiments vGPU stopped working.
I can create and attach new vGPU, but when I'm trying to start VM with vGPU, it hangs for about 60 seconds and than start without problems. But in OS I can't find vGPU any more.In dmesg I can see a lot of error messages from
gim[692523.372640] <1>Uncorrectable error found 0xffffffff [692523.372642] <1> Can't clear the error [692523.372646] PF1 gim info:(check_base_addrs:1974) CP_MQD_BASE_ADDR = 0xffffffff:ffffffff [692523.372660] gim warning:(dump_gpu_status:2029) mmGRBM_STATUS = 0xffffffff [692523.372662] gim warning:(dump_gpu_status:2032) mmGRBM_STATUS2 = 0xffffffff [692523.372663] gim warning:(dump_gpu_status:2035) mmSRBM_STATUS = 0xffffffff [692523.372665] gim warning:(dump_gpu_status:2038) mmSRBM_STATUS2 = 0xffffffff [692523.372667] gim warning:(dump_gpu_status:2041) mmSDMA0_STATUS_REG = 0xffffffff [692523.372668] gim warning:(dump_gpu_status:2044) mmSDMA1_STATUS_REG = 0xffffffff [692523.372670] gim warning:(dump_gpu_status:2056) GFX busy [692523.372671] gim warning:(dump_gpu_status:2062) CP busy [692523.372672] gim warning:(dump_gpu_status:2070) RLC busy [692523.372674] gim warning:(dump_gpu_status:2074) RLC_STAT = 0xffffffff [692523.372675] gim warning:(dump_gpu_status:2076) RLC busy processing a context switch [692523.372677] gim warning:(dump_gpu_status:2078) RLC Graphics Power Management unit is busy [692523.372677] gim warning:(dump_gpu_status:2080) RLC Streaming Performance Monitor block is busy [692523.372679] gim warning:(dump_gpu_status:2085) RLC_GPM_STAT = 0xffffffff - RLC GPM module is busy [692523.372680] gim warning:(dump_gpu_status:2092) CP busy [692523.372681] gim warning:(dump_gpu_status:2102) SDMA busy [692523.372682] gim warning:(dump_gpu_status:2108) SDMA1 busy [692523.372683] gim warning:(dump_gpu_status:2114) XDMA busy [692523.372686] gim warning:(dump_gpu_status:2138) DRM busy [692523.372687] gim warning:(dump_gpu_status:2146) SEM busy [692523.372688] gim warning:(dump_gpu_status:2159) GRBM busy [692523.372688] gim warning:(dump_gpu_status:2172) VMC busy [692523.372690] gim warning:(dump_gpu_status:2185) CP_CPF_STATUS = 0xffffffff [692523.372691] gim warning:(dump_gpu_status:2188) The write pointer has been updated and the initiated work is still being processed by the GFX pipe [692523.372692] gim warning:(dump_gpu_status:2192) The HQD is busy for any of the following reasons: sending a message, fetching data, or reorder queues not empty [692523.372693] gim warning:(dump_gpu_status:2196) The Compute part of CPF is Busy. [692523.372695] PF1 gim info:(check_ME_CNTL:1945) CP_ME_CNTL = 0xffffffff GPU dump [692523.372696] gim error:(check_ME_CNTL:1948) ME HALTED! [692523.372701] gim error:(check_ME_CNTL:1952) PFP HALTED! [692523.372706] gim error:(check_ME_CNTL:1956) CE HALTED! [692523.372711] gim warning:(dump_gpu_status:2203) CP_CPF_BUSY_STAT = 0xffffffff [692523.372712] gim warning:(dump_gpu_status:2206) The HQD has a pending Wait semaphore [692523.372713] gim warning:(dump_gpu_status:2209) **** dump gpu status end [692523.372714] gim error:(switch_to_pf:2665) Failed to LOAD PF [692523.372721] PF1 gim info:(dump_pf_vm_regs:207) 0xffffffff - HDP_NONSURFACE_BASE [692523.372723] PF1 gim info:(dump_pf_vm_regs:207) 0xffffffff - MC_VM_FB_LOCATION [692523.372725] PF1 gim info:(dump_pf_vm_regs:207) 0xffffffff - MC_VM_FB_OFFSET [692523.372727] PF1 gim info:(dump_pf_vm_regs:207) 0xffffffff - MC_VM_SYSTEM_APERTURE_HI [692523.372729] PF1 gim info:(dump_pf_vm_regs:207) 0xffffffff - MC_VM_SYSTEM_APERTURE_LO [692523.372730] PF1 gim info:(dump_pf_vm_regs:207) 0xffffffff - MC_VM_SYSTEM_APERTURE_DEF [692523.372732] PF1 gim info:(dump_pf_vm_regs:207) 0xffffffff - MC_VM_MX_L1_TLB_CNTL [692523.372734] PF1 gim info:(dump_pf_vm_regs:207) 0xffffffff - RLC_GPU_IOV_ACTIVE_FCN_ID [692523.372736] PF1 gim info:(dump_pf_vm_regs:207) 0xffffffff - SMU_ACTIVE_FCN_ID [692523.372739] PF1 gim info:(dump_pf_vm_regs:207) 0xffffffff - IH_ACTIVE_FCN_ID [692523.372740] PF1 gim info:(dump_pf_vm_regs:207) 0xffffffff - MC_SHARED_ACTIVE_FCN_ID [692523.372743] PF1 gim info:(dump_pf_vm_regs:207) 0xffffffff - SDMA0_ACTIVE_FCN_ID [692523.372744] PF1 gim info:(dump_pf_vm_regs:207) 0xffffffff - SDMA1_ACTIVE_FCN_ID [692523.372746] PF1 gim info:(dump_pf_vm_regs:207) 0xffffffff - SEM_ACTIVE_FCN_ID [692523.372748] PF1 gim info:(dump_pf_vm_regs:207) 0xffffffff - VM_CONTEXT0_PROTECTION_FAULT_DEFAULT_ADDRESS [692523.372750] gim warning:(clear_vf_fb:3357) Check out switch_vfs returning -1. This is unexpected [692523.372751] gim warning:(free_vf:3618) Clear of VF1-0 FB failed [692523.372753] VF1-0 gim info:(free_vf:3661) VF1-0 is in the Undefined state while trying to FREE it [692523.372754] VF1-0 gim info:(free_vf:3666) VF1-0 can be freed from the Undefined state [692523.372761] gim warning:(free_vf:3701) PF is not present at the end of VF_FREE [692525.015347] pciback 0000:85:02.0: timed out waiting for pending transaction; performing function level reset anyway [692526.263277] pciback 0000:85:02.0: not ready 1023ms after FLR; waiting [692527.319289] pciback 0000:85:02.0: not ready 2047ms after FLR; waiting [692529.399246] pciback 0000:85:02.0: not ready 4095ms after FLR; waiting [692533.751187] pciback 0000:85:02.0: not ready 8191ms after FLR; waiting [692542.199002] pciback 0000:85:02.0: not ready 16383ms after FLR; waiting [692559.350673] pciback 0000:85:02.0: not ready 32767ms after FLR; waiting [692594.166251] pciback 0000:85:02.0: not ready 65535ms after FLR; giving upMaybe VM hard shutdown "killed" it?
The question is - is it possible to fix it without reboot or any other option to fix it?
For NVIDIA GPUs there is some cli tool
nvidia-smi.
You can "reset" NVIDIA GPU with this tool.On the Internet, I found that there is a tool for AMD GPUs as well.
It calledGRU tooland could be build from source https://github.com/GPUOpen-LibrariesAndSDKs/MxGPU-Virtualization/tree/master/utils/gru
Is it possible to install it from official xcp-ng repo?
Or how to build it correctly for xcp-ng?Toolstack restart does not fixed it.
-
I compiled
gruon the test host and copied it to host with GPU, but it does not work.
When I'm trying to startgruan error occurredcat: /sys/bus/pci/drivers/gim/gpuinfo: No such file or directory Can't detect a device Detect device failedI have tried to reset GPU manually with command
echo "1" > /sys/bus/pci/devices/0000\:85:00.0/reset, but it didn't work too.modprobe -r gim modprobe gim xe-toolstack-restartDidn't work too.
Seems that VM
hard shutdownblocked something in pGPU (for example GPU RAM) and now it can't allocate a new area of memory.
We need some tool to control AMD GPUs in XCP-ng.Any ideas?
-
I am having this same issue with my setup. Except I never had the GPU in the guest working. My guests take about 60s to start and to shut down and lots of gim errors on my host. This is a fresh install on my server.
I finally got it working (kind of). So it only works if my xcp-ng server has been rebooted and it's the first time I'm starting the VM that has the GPU attached (so gim module is not loaded yet and hasn't virtualized my video card). The VM starts right up and no errors in dmesg and I see the card in my guest. However if I restart that VM, it takes ~60 seconds to come back up and I get those errors in dmesg and the card no longer shows up in the VM. This definitely seems like an issue trying to get it to work after gim has been loaded. I do get some errors after it has successfully loaded though. lspci still shows the card is loaded even after that last error in dmesg. Still not quite sure what is going on here.[ 412.511208] VF1-0 gim info:(handle_rel_gpu_init_access:1373) Using the IOCTL/sysfs interface [ 412.511215] gim info:(gim_sysfs_send:113) Sending "BA,U0x5320/0x28,U0x540c/4,U0x5480/4" message for VF1-0 to QEMU pid 6533 [ 412.511338] gim info:(gim_sys_read:295) gim_sys_read() - BA,U0x5320/0x28,U0x540c/4,U0x5480/4 in command buffer for VF1-0 [ 412.511343] gim info:(gim_sys_read:297) gim_sys_read, ret = 35 [ 412.525023] gim info:(print_gim_version:62) GPU IOV MODULE (GIM) - version 2.00.0000 [ 412.525025] gim info:(gim_ioctl:450) GIM_IOCTL_MMIO_IS_BLOCKED [ 412.525027] gim info:(gim_ioctl:454) MMIO is BLOCKED for VF1-0 [ 412.530507] VF1-0 gim info:(wait_for_mmio_blocked:260) block_mmio() took 0.19282868 seconds to complete [ 412.530510] VF1-0 gim info:(wait_for_mmio_blocked:285) QEMU successfully blocked MMIO in 0.19282868 seconds [ 412.530512] VF1-0 gim info:(handle_rel_gpu_init_access:1395) VF0 is indicated as the current running vf [ 412.530515] PF1 gim info:(resume_scheduler:381) Restart the Scheduler for 500 msec [ 412.530518] PF1 gim info:(mailbox_work_handler:4251) mailbox_work_handler completed [ 648.371177] gim error:(wait_cmd_complete:2387) wait_cmd_complete -- time out after 0.003006804 sec [ 648.371219] gim error:(wait_cmd_complete:2390) Cmd = 0xff, Status = 0xff, cmd_Complete=0 [ 648.371239] Current function = [ 648.371242] PF1 gim warning:(dump_function_state:248) VF0 [ 648.371243] PF1 gim warning:(dump_function_state:254) Last known states: [ 648.371246] PF1 gim warning:(dump_function_state:255) PF = Save [ 648.371249] VF1-0 gim warning:(dump_function_state:259) Run , Marked as Runable [ 648.371251] gim warning:(dump_gpu_status:1987) **** dump gpu status begin for Adapter 135:00.00 [ 648.371254] <1>Uncorrectable error found 0xffffffff [ 648.371259] <1> Can't clear the error [ 648.371263] VF1-0 gim info:(check_base_addrs:1974) CP_MQD_BASE_ADDR = 0xffffffff:ffffffff [ 648.371269] gim warning:(dump_gpu_status:2029) mmGRBM_STATUS = 0xffffffff [ 648.371271] gim warning:(dump_gpu_status:2032) mmGRBM_STATUS2 = 0xffffffff [ 648.371273] gim warning:(dump_gpu_status:2035) mmSRBM_STATUS = 0xffffffff [ 648.371275] gim warning:(dump_gpu_status:2038) mmSRBM_STATUS2 = 0xffffffff [ 648.371277] gim warning:(dump_gpu_status:2041) mmSDMA0_STATUS_REG = 0xffffffff [ 648.371279] gim warning:(dump_gpu_status:2044) mmSDMA1_STATUS_REG = 0xffffffff [ 648.371280] gim warning:(dump_gpu_status:2056) GFX busy [ 648.371282] gim warning:(dump_gpu_status:2062) CP busy [ 648.371283] gim warning:(dump_gpu_status:2070) RLC busy [ 648.371285] gim warning:(dump_gpu_status:2074) RLC_STAT = 0xffffffff [ 648.371286] gim warning:(dump_gpu_status:2076) RLC busy processing a context switch [ 648.371288] gim warning:(dump_gpu_status:2078) RLC Graphics Power Management unit is busy [ 648.371289] gim warning:(dump_gpu_status:2080) RLC Streaming Performance Monitor block is busy [ 648.371291] gim warning:(dump_gpu_status:2085) RLC_GPM_STAT = 0xffffffff - RLC GPM module is busy [ 648.371292] gim warning:(dump_gpu_status:2092) CP busy [ 648.371294] gim warning:(dump_gpu_status:2102) SDMA busy [ 648.371295] gim warning:(dump_gpu_status:2108) SDMA1 busy [ 648.371296] gim warning:(dump_gpu_status:2114) XDMA busy [ 648.371298] gim warning:(dump_gpu_status:2138) DRM busy [ 648.371299] gim warning:(dump_gpu_status:2146) SEM busy [ 648.371300] gim warning:(dump_gpu_status:2159) GRBM busy [ 648.371302] gim warning:(dump_gpu_status:2172) VMC busy [ 648.371303] gim warning:(dump_gpu_status:2185) CP_CPF_STATUS = 0xffffffff [ 648.371305] gim warning:(dump_gpu_status:2188) The write pointer has been updated and the initiated work is still being processed by the GFX pipe [ 648.371306] gim warning:(dump_gpu_status:2192) The HQD is busy for any of the following reasons: sending a message, fetching data, or reorder queues not empty [ 648.371307] gim warning:(dump_gpu_status:2196) The Compute part of CPF is Busy. [ 648.371311] PF1 gim info:(check_ME_CNTL:1945) CP_ME_CNTL = 0xffffffff GPU dump [ 648.371312] gim error:(check_ME_CNTL:1948) ME HALTED! [ 648.371326] gim error:(check_ME_CNTL:1952) PFP HALTED! [ 648.371339] gim error:(check_ME_CNTL:1956) CE HALTED! [ 648.371352] gim warning:(dump_gpu_status:2203) CP_CPF_BUSY_STAT = 0xffffffff [ 648.371354] gim warning:(dump_gpu_status:2206) The HQD has a pending Wait semaphore [ 648.371355] gim warning:(dump_gpu_status:2209) **** dump gpu status end [ 648.371359] VF1-0 gim info:(idle_vf:2566) Wait returned rc 1 for VF1-0. Idle latency = 0.000000. Idle count = 0, run count = 0 [ 648.371361] gim warning:(switch_away_from_function:2831) Failed to idle VF0 [ 648.371363] gim warning:(schedule_next_function:3802) Failed to switch from VF0 to VF0 [ 648.371367] gim warning:(world_switch:4042) schedule VF0 to VF0 failed, failure reason is FLR_REASON_FAILED_IDLE (3), try to reset [ 648.371369] gim warning:(world_switch:4045) VF1-0.runable = 1, VF1-0.runable = 1 [ 648.371386] gim error:(gim_sched_reset:5230) Cannot proceed with FLR as GPU has disappeared from the bus [ 648.371406] gim error:(world_switch:4059) FLR failed, quick exit out of scheduler. Make sure scheduler is pausedEDIT:
It looks like it doesn't stay working in the guest. I went to do a GPU test and it doesn't show the card anymore. Ugh this is frustrating. -
In my case problem was in bad connection.
I have reassembled server, cleaned PCI-e (GPU) contacts and now it is stable.But it will be nice to have some tool to control and monitor AMD GPUs.
-
Some time later I faced with problem that VMs (Linux and Windows) can't correctly start GPU (ADM MxGPU).
In windows device manager there was error #43.
I have solved this error without host reboot by reloadinggimmodule.Hope this will help somebody else.
rmmod gim gim_api
modprobe gim gim_api
Hello! It looks like you're interested in this conversation, but you don't have an account yet.
Getting fed up of having to scroll through the same posts each visit? When you register for an account, you'll always come back to exactly where you were before, and choose to be notified of new replies (either via email, or push notification). You'll also be able to save bookmarks and upvote posts to show your appreciation to other community members.
With your input, this post could be even better 💗
Register Login