@olivierlambert Still working on it. It's between a4986 and 494ea.
-
RE: the writer IncrementalRemoteWriter has failed the step writer.beforeBackup() with error Lock file is already being held. It won't be used anymore in this job execution.
-
RE: the writer IncrementalRemoteWriter has failed the step writer.beforeBackup() with error Lock file is already being held. It won't be used anymore in this job execution.
@florent So it does seem to be working now. I'm on the latest version and backups are fine. Attached are the 2 jsons of the failed jobs. It's technically only the 1 backup, but there were 2 failed jobs per backup job.
2025-02-16T22_00_00.004Z - backup NG.txt
2025-02-16T22_00_00.007Z - backup NG.txt -
RE: the writer IncrementalRemoteWriter has failed the step writer.beforeBackup() with error Lock file is already being held. It won't be used anymore in this job execution.
Ok so I'm not sure what happened but it's working fine now, I made it all the way back to commit 494ea and my backups continue to work. I have done nothing except move between commits. Maybe something happened when updating before? I am going to move to the latest commit and see if it continues to work.
-
RE: the writer IncrementalRemoteWriter has failed the step writer.beforeBackup() with error Lock file is already being held. It won't be used anymore in this job execution.
@olivierlambert Still working on it. It's between a4986 and 494ea.
-
RE: the writer IncrementalRemoteWriter has failed the step writer.beforeBackup() with error Lock file is already being held. It won't be used anymore in this job execution.
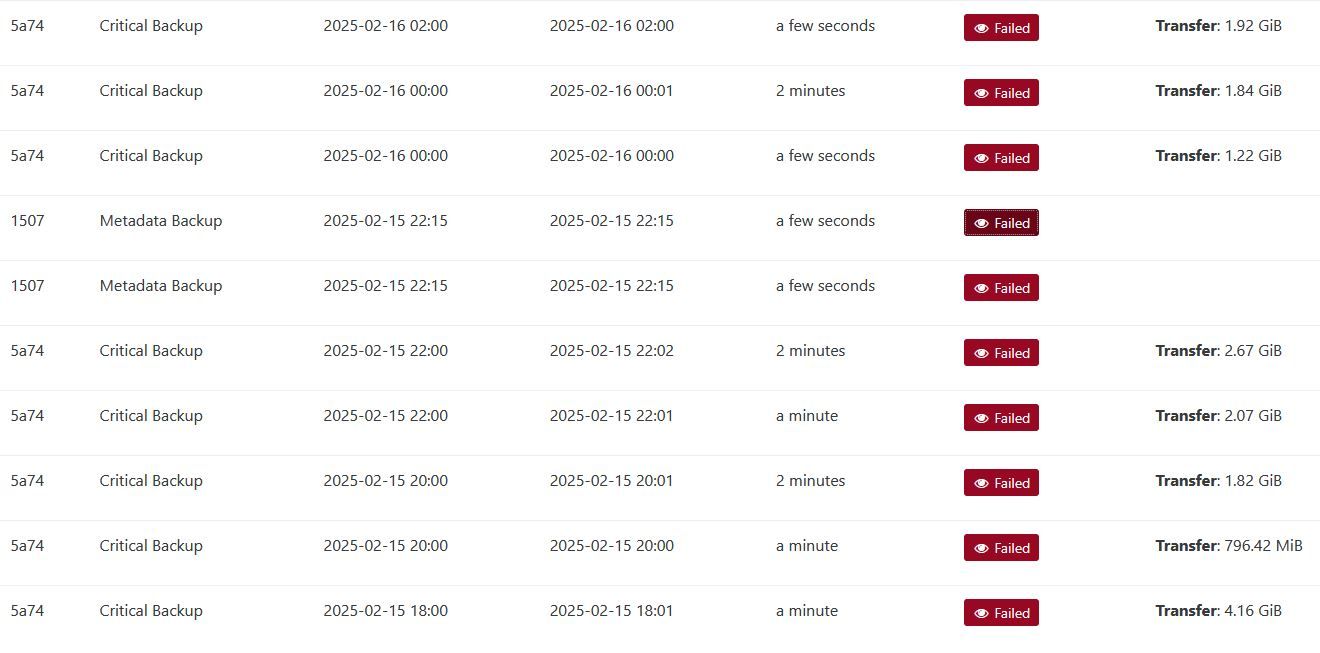
So since I went back to an older version, I have not had a single backup fail. I have 3 main backups that run. 2 of them daily (my pool metadata/XO config and a delta of 18vms) and then 1 every 2 hours (also a delta but only of 3 vms). ALL of them would fail in one way or another, even the metadata. Something I just noticed now is it looks like each backup is starting twice or at least there are failed logs indicating so. If they are actually running twice that would explain the errors. This would also explain why clicking the retry backup option would always succeed.
Error from the metadata backup:
EEXIST: file already exists, open '/run/xo-server/mounts/c9199dfc-af05-4707-badb-8741e61daafb/xo-config-backups/f19069dd-f98b-4b41-9ca8-0e711fc75968/20250216T041500Z/data.json' -
RE: the writer IncrementalRemoteWriter has failed the step writer.beforeBackup() with error Lock file is already being held. It won't be used anymore in this job execution.
@olivierlambert I went back to my prior version, which was commit 04dd9. And the very next backup finished successfully. Not sure if this was a fluke, but I have backups going every 2 hours and this was the first to finish successfully today without me clicking the button to retry the backup. I'll report tomorrow on whether they continue to work or not.
-
RE: the writer IncrementalRemoteWriter has failed the step writer.beforeBackup() with error Lock file is already being held. It won't be used anymore in this job execution.
So I started getting this a few days ago as well. My backups have been fine for over a year until now, they are constantly failing at random. They will usually succeed just fine if I restart the failed backup. I am currently on commit 494ea. I haven't had time to delve into this though. I just found this post when initially googling.
-
RE: vdi related to multiple VMs? - Error with backups
I am running the latest XO. I ended up fixing the issue, it has backed up successfully 2 times now without any errors. What I did was removed ALL snapshots for the specific VM. Once the tasks finished for removing the snapshots, I created a new manual snapshot. Then let the backup happen as normal. What I noticed though is the backup snapshot replaced my manual snapshot so the VM still only has 1 snapshot. But it seems to be working now.
-
vdi related to multiple VMs? - Error with backups
I recently started getting the below error on one of my VMs. It was backing up just fine and now it errors out every time and won't create any new snapshot or backup. If I remove the snapshot that the backup creates, it behaves differently. It will create a new snapshot and has green for the backup but then still errors out with the same error. I'm unsure of what's going on and googling has been no help. I have no issues on the backup health tab. All other VMs back up without issue. I've never cloned this VM or done anything with the disks.
Whole error on every backup unless snapshot is manually removed:
Start: 2024-12-19 05:21
End: 2024-12-19 05:21
Duration: a few seconds
Error: _removeUnusedSnapshots don t handle vdi related to multiple VMsWhole error when I remove snapshot then backup:
Snapshot (successful)
Start: 2024-12-19 20:06
End: 2024-12-19 20:06
Backup (successful)
transfer (successful)
Start: 2024-12-19 20:06
End: 2024-12-19 20:26
Duration: 20 minutes
Size: 62.53 GiB
Speed: 54.53 MiB/s
Start: 2024-12-19 20:06
End: 2024-12-19 20:26
Duration: 20 minutes
Start: 2024-12-19 20:06
End: 2024-12-19 20:26
Duration: 20 minutes
Error: _removeUnusedSnapshots don t handle vdi related to multiple VMs -
RE: How to control AMD GPU?
I am having this same issue with my setup. Except I never had the GPU in the guest working. My guests take about 60s to start and to shut down and lots of gim errors on my host. This is a fresh install on my server.
I finally got it working (kind of). So it only works if my xcp-ng server has been rebooted and it's the first time I'm starting the VM that has the GPU attached (so gim module is not loaded yet and hasn't virtualized my video card). The VM starts right up and no errors in dmesg and I see the card in my guest. However if I restart that VM, it takes ~60 seconds to come back up and I get those errors in dmesg and the card no longer shows up in the VM. This definitely seems like an issue trying to get it to work after gim has been loaded. I do get some errors after it has successfully loaded though. lspci still shows the card is loaded even after that last error in dmesg. Still not quite sure what is going on here.[ 412.511208] VF1-0 gim info:(handle_rel_gpu_init_access:1373) Using the IOCTL/sysfs interface [ 412.511215] gim info:(gim_sysfs_send:113) Sending "BA,U0x5320/0x28,U0x540c/4,U0x5480/4" message for VF1-0 to QEMU pid 6533 [ 412.511338] gim info:(gim_sys_read:295) gim_sys_read() - BA,U0x5320/0x28,U0x540c/4,U0x5480/4 in command buffer for VF1-0 [ 412.511343] gim info:(gim_sys_read:297) gim_sys_read, ret = 35 [ 412.525023] gim info:(print_gim_version:62) GPU IOV MODULE (GIM) - version 2.00.0000 [ 412.525025] gim info:(gim_ioctl:450) GIM_IOCTL_MMIO_IS_BLOCKED [ 412.525027] gim info:(gim_ioctl:454) MMIO is BLOCKED for VF1-0 [ 412.530507] VF1-0 gim info:(wait_for_mmio_blocked:260) block_mmio() took 0.19282868 seconds to complete [ 412.530510] VF1-0 gim info:(wait_for_mmio_blocked:285) QEMU successfully blocked MMIO in 0.19282868 seconds [ 412.530512] VF1-0 gim info:(handle_rel_gpu_init_access:1395) VF0 is indicated as the current running vf [ 412.530515] PF1 gim info:(resume_scheduler:381) Restart the Scheduler for 500 msec [ 412.530518] PF1 gim info:(mailbox_work_handler:4251) mailbox_work_handler completed [ 648.371177] gim error:(wait_cmd_complete:2387) wait_cmd_complete -- time out after 0.003006804 sec [ 648.371219] gim error:(wait_cmd_complete:2390) Cmd = 0xff, Status = 0xff, cmd_Complete=0 [ 648.371239] Current function = [ 648.371242] PF1 gim warning:(dump_function_state:248) VF0 [ 648.371243] PF1 gim warning:(dump_function_state:254) Last known states: [ 648.371246] PF1 gim warning:(dump_function_state:255) PF = Save [ 648.371249] VF1-0 gim warning:(dump_function_state:259) Run , Marked as Runable [ 648.371251] gim warning:(dump_gpu_status:1987) **** dump gpu status begin for Adapter 135:00.00 [ 648.371254] <1>Uncorrectable error found 0xffffffff [ 648.371259] <1> Can't clear the error [ 648.371263] VF1-0 gim info:(check_base_addrs:1974) CP_MQD_BASE_ADDR = 0xffffffff:ffffffff [ 648.371269] gim warning:(dump_gpu_status:2029) mmGRBM_STATUS = 0xffffffff [ 648.371271] gim warning:(dump_gpu_status:2032) mmGRBM_STATUS2 = 0xffffffff [ 648.371273] gim warning:(dump_gpu_status:2035) mmSRBM_STATUS = 0xffffffff [ 648.371275] gim warning:(dump_gpu_status:2038) mmSRBM_STATUS2 = 0xffffffff [ 648.371277] gim warning:(dump_gpu_status:2041) mmSDMA0_STATUS_REG = 0xffffffff [ 648.371279] gim warning:(dump_gpu_status:2044) mmSDMA1_STATUS_REG = 0xffffffff [ 648.371280] gim warning:(dump_gpu_status:2056) GFX busy [ 648.371282] gim warning:(dump_gpu_status:2062) CP busy [ 648.371283] gim warning:(dump_gpu_status:2070) RLC busy [ 648.371285] gim warning:(dump_gpu_status:2074) RLC_STAT = 0xffffffff [ 648.371286] gim warning:(dump_gpu_status:2076) RLC busy processing a context switch [ 648.371288] gim warning:(dump_gpu_status:2078) RLC Graphics Power Management unit is busy [ 648.371289] gim warning:(dump_gpu_status:2080) RLC Streaming Performance Monitor block is busy [ 648.371291] gim warning:(dump_gpu_status:2085) RLC_GPM_STAT = 0xffffffff - RLC GPM module is busy [ 648.371292] gim warning:(dump_gpu_status:2092) CP busy [ 648.371294] gim warning:(dump_gpu_status:2102) SDMA busy [ 648.371295] gim warning:(dump_gpu_status:2108) SDMA1 busy [ 648.371296] gim warning:(dump_gpu_status:2114) XDMA busy [ 648.371298] gim warning:(dump_gpu_status:2138) DRM busy [ 648.371299] gim warning:(dump_gpu_status:2146) SEM busy [ 648.371300] gim warning:(dump_gpu_status:2159) GRBM busy [ 648.371302] gim warning:(dump_gpu_status:2172) VMC busy [ 648.371303] gim warning:(dump_gpu_status:2185) CP_CPF_STATUS = 0xffffffff [ 648.371305] gim warning:(dump_gpu_status:2188) The write pointer has been updated and the initiated work is still being processed by the GFX pipe [ 648.371306] gim warning:(dump_gpu_status:2192) The HQD is busy for any of the following reasons: sending a message, fetching data, or reorder queues not empty [ 648.371307] gim warning:(dump_gpu_status:2196) The Compute part of CPF is Busy. [ 648.371311] PF1 gim info:(check_ME_CNTL:1945) CP_ME_CNTL = 0xffffffff GPU dump [ 648.371312] gim error:(check_ME_CNTL:1948) ME HALTED! [ 648.371326] gim error:(check_ME_CNTL:1952) PFP HALTED! [ 648.371339] gim error:(check_ME_CNTL:1956) CE HALTED! [ 648.371352] gim warning:(dump_gpu_status:2203) CP_CPF_BUSY_STAT = 0xffffffff [ 648.371354] gim warning:(dump_gpu_status:2206) The HQD has a pending Wait semaphore [ 648.371355] gim warning:(dump_gpu_status:2209) **** dump gpu status end [ 648.371359] VF1-0 gim info:(idle_vf:2566) Wait returned rc 1 for VF1-0. Idle latency = 0.000000. Idle count = 0, run count = 0 [ 648.371361] gim warning:(switch_away_from_function:2831) Failed to idle VF0 [ 648.371363] gim warning:(schedule_next_function:3802) Failed to switch from VF0 to VF0 [ 648.371367] gim warning:(world_switch:4042) schedule VF0 to VF0 failed, failure reason is FLR_REASON_FAILED_IDLE (3), try to reset [ 648.371369] gim warning:(world_switch:4045) VF1-0.runable = 1, VF1-0.runable = 1 [ 648.371386] gim error:(gim_sched_reset:5230) Cannot proceed with FLR as GPU has disappeared from the bus [ 648.371406] gim error:(world_switch:4059) FLR failed, quick exit out of scheduler. Make sure scheduler is pausedEDIT:
It looks like it doesn't stay working in the guest. I went to do a GPU test and it doesn't show the card anymore. Ugh this is frustrating.