8.3 netinstall
default boot options, no changes in BIOS.
USB with ISO did not work.
KVM with loaded ISO did the trick.
Wait long enough to make sure your ISO is uploaded fully.
Good luck! 
8.3 netinstall
default boot options, no changes in BIOS.
USB with ISO did not work.
KVM with loaded ISO did the trick.
Wait long enough to make sure your ISO is uploaded fully.
Good luck! 
@phil182182 We have done it on one EX130-S.
We had crashes with 8.2, but everything went fine with 8.3 Beta.
Online for about 1 month already with zero problems so far.
I suggest you to try the installation one more time with 8.3 Beta.
@olivierlambert Thank you!
Do you actually "feel" the difference in terms of VM performance for your services?
OF COURSE! Was very slow.
You cannot imagine the difference...
This is an AMD Ryzen 9 7950X3D host.
Moreover, since the problem started we migrated several VMs to other hosts.
If you see the screenshots above, in xentop output, besides Dom0, all other VMs where like hardly using 2-3 CPUs in total.
And everything was dead slow (steal time always high).
My feeling here is that this was somehow related to networking (tap*), but really don't know what and why.
Glad this was resolved after the reboot.
@lovvel Personally I would avoid assigning cores to domU without a very specific reason to do this, I prefer to have the kernel decide. Especially since we are talking about virtualization.
CPU 7950X3D indeed has 2 separate CCDs with different cache (per 8 cores) and different max clock speeds, but there are many factors when Xen also enters the field, especially regarding the max clock speed. I don't know if this is even possible on 7950X3D.
I know that my answer above might not exactly answer your questions.
@olivierlambert Thank you!
Do you actually "feel" the difference in terms of VM performance for your services?
OF COURSE! Was very slow.
You cannot imagine the difference...
This is an AMD Ryzen 9 7950X3D host.
Moreover, since the problem started we migrated several VMs to other hosts.
If you see the screenshots above, in xentop output, besides Dom0, all other VMs where like hardly using 2-3 CPUs in total.
And everything was dead slow (steal time always high).
My feeling here is that this was somehow related to networking (tap*), but really don't know what and why.
Glad this was resolved after the reboot.
The problem I described got resolved some hours ago.
Indeed the steal time was not reasonable. It was not normal, it was not because of many demanding VMs running on the same host.
I am writing more here, because it might be related to some bug or another case.
Some findings and the very simple solution:
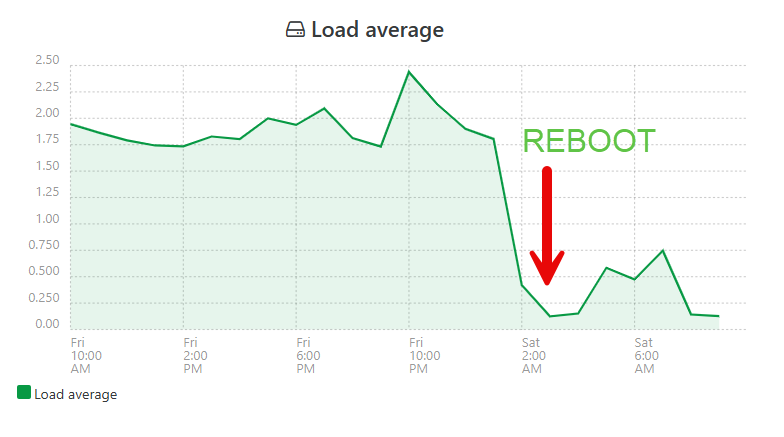
xentop on the host showed once in a while a very big value on CPU(%) for dom0. This was very strage.pvclock_clocksource_read call was having the most CPU% above any other server task/call (this is on an AMD Ryzen host).Magically, the solution was to reboot the host!
Since the problem started we had also installed updates on Xen/XCP-ng stack, but done only xe-toolstack-restart until now (running XCP-ng 8.3).
I am also attaching here some extra screenshots, please note the xentop output on last screenshot, the yellow painted row is Dom0. See the CPU(%). This was once every about 20 seconds showing a value like that. The value is so high that looks like an overflow or something.
The steal time graph on a random VM on this host. Showing the enormous steal time from 20-Sep until the resolution (reboot) some hours ago.

The "Load Average" graph inside XenOrchestra, showing a big drop after the reboot.

The screenshot of xentop I mentioned above showing the high CPU% value on Dom0 once in a while.
In my opinion this here might be saying something (if not a bug).

After some investigation I see that a lot of CPU cycles are given to pvclock_clocksource_read calls
(like 30%+ on a VM)
Then I found some relevant discussions on clocksource and Xen and the benefit of tsc.
But seems that tsc is missing 
On domU:
# cat /sys/devices/system/clocksource/clocksource0/available_clocksource
xen hpet acpi_pm
#  cat /sys/devices/system/clocksource/clocksource0/current_clocksource
xen
(on dom0 the same as above)
And:
# dmesg | grep -i tsc
[    0.000000] [Firmware Bug]: TSC doesn't count with P0 frequency!
[    0.023407] tsc: Fast TSC calibration using PIT
[    0.023408] tsc: Detected 4192.045 MHz processor
[    0.023408] tsc: Detected 4192.168 MHz TSC
[    0.681699] clocksource: tsc-early: mask: 0xffffffffffffffff max_cycles: 0x3c6d7a8273c, max_idle_ns: 440795242263 ns
[    0.741364] clocksource: Switched to clocksource tsc-early
[    1.893775] clocksource: tsc: mask: 0xffffffffffffffff max_cycles: 0x3c6d7a8273c, max_idle_ns: 440795242263 ns
[    1.893845] clocksource: Switched to clocksource tsc
[509638.654338] clocksource: timekeeping watchdog on CPU1: Marking clocksource 'tsc' as unstable because the skew is too large:
[509638.654338] clocksource:                       'tsc' cs_now: 797578a475b6a cs_last: 79757086afc52 mask: ffffffffffffffff
[509638.654338] tsc: Marking TSC unstable due to clocksource watchdog
Is this normal? That the tsc is missing?
Is the hardware only related? If yes, are they usually any BIOS settings that can help having tsc?
Thank you.
@olivierlambert said in Large "steal time" inside VMs but host CPU is not overloaded:
Ah sorry I wasn't clear: it's even more complex than this. The load average is for the Dom0 only. The CPU stats graph is for the whole host (because you do not have all your cores visible in the Dom0, as it's "just" a VM)

Yessss, we got it! This definitely needs some clarification on the UI.
So since "CPU usage" graph is for the whole host (which makes this graph really useful), I still believe that with the values shown in "CPU usage" graph in the screenshot, having steal values of 30 or 40 in a VM is quite a lot.
On a second thought now, maybe CPU is not the reason of that steal time values. I am thinking maybe steal time is also related to disk and network usage, so maybe the bottleneck is there.
I will also try your suggestion (see steal time with noisy VMs off).
Thank you.
I was under the impression that Xen Orchestra stats shown (graphs) are for the whole host.
Not dom0 stats. Since they are dom0 stats, this is now much more clear.
Thank you for making this clear.
Also I thought that xentop is a good source to count how many CPU are actually in use on a given moment on host, by a simple sum of the CPU(%) column.
I had in my mind that as long as CPU(%) sum on xentop is lower than "host CPU threads count" x 100, the host CPUs is not under pressure.
Best regards.
assuming you have 8vCPUs in your Dom0,
dom0 has 16 vCPUs.
This is also the number that /opt/xensource/bin/host-cpu-tune suggests.
Are you witnessing actual performance problems?
Yes, for some hours days ago, this is how I started investigating this.
May I ask something to clarify:
On Xen Orchestra graphs, the "Load Average" is confusing me a bit, since as you can see in the screenshots the values are around 1.00. Seems that this is not the classic/typical load average, isn't it?
On classic load average I would expect "load average of 1 = 1 CPU", so with 32 CPUs we need 32 load average to have all CPU threads fully utilized.
I guess this "load average" on the graph is something different, right?
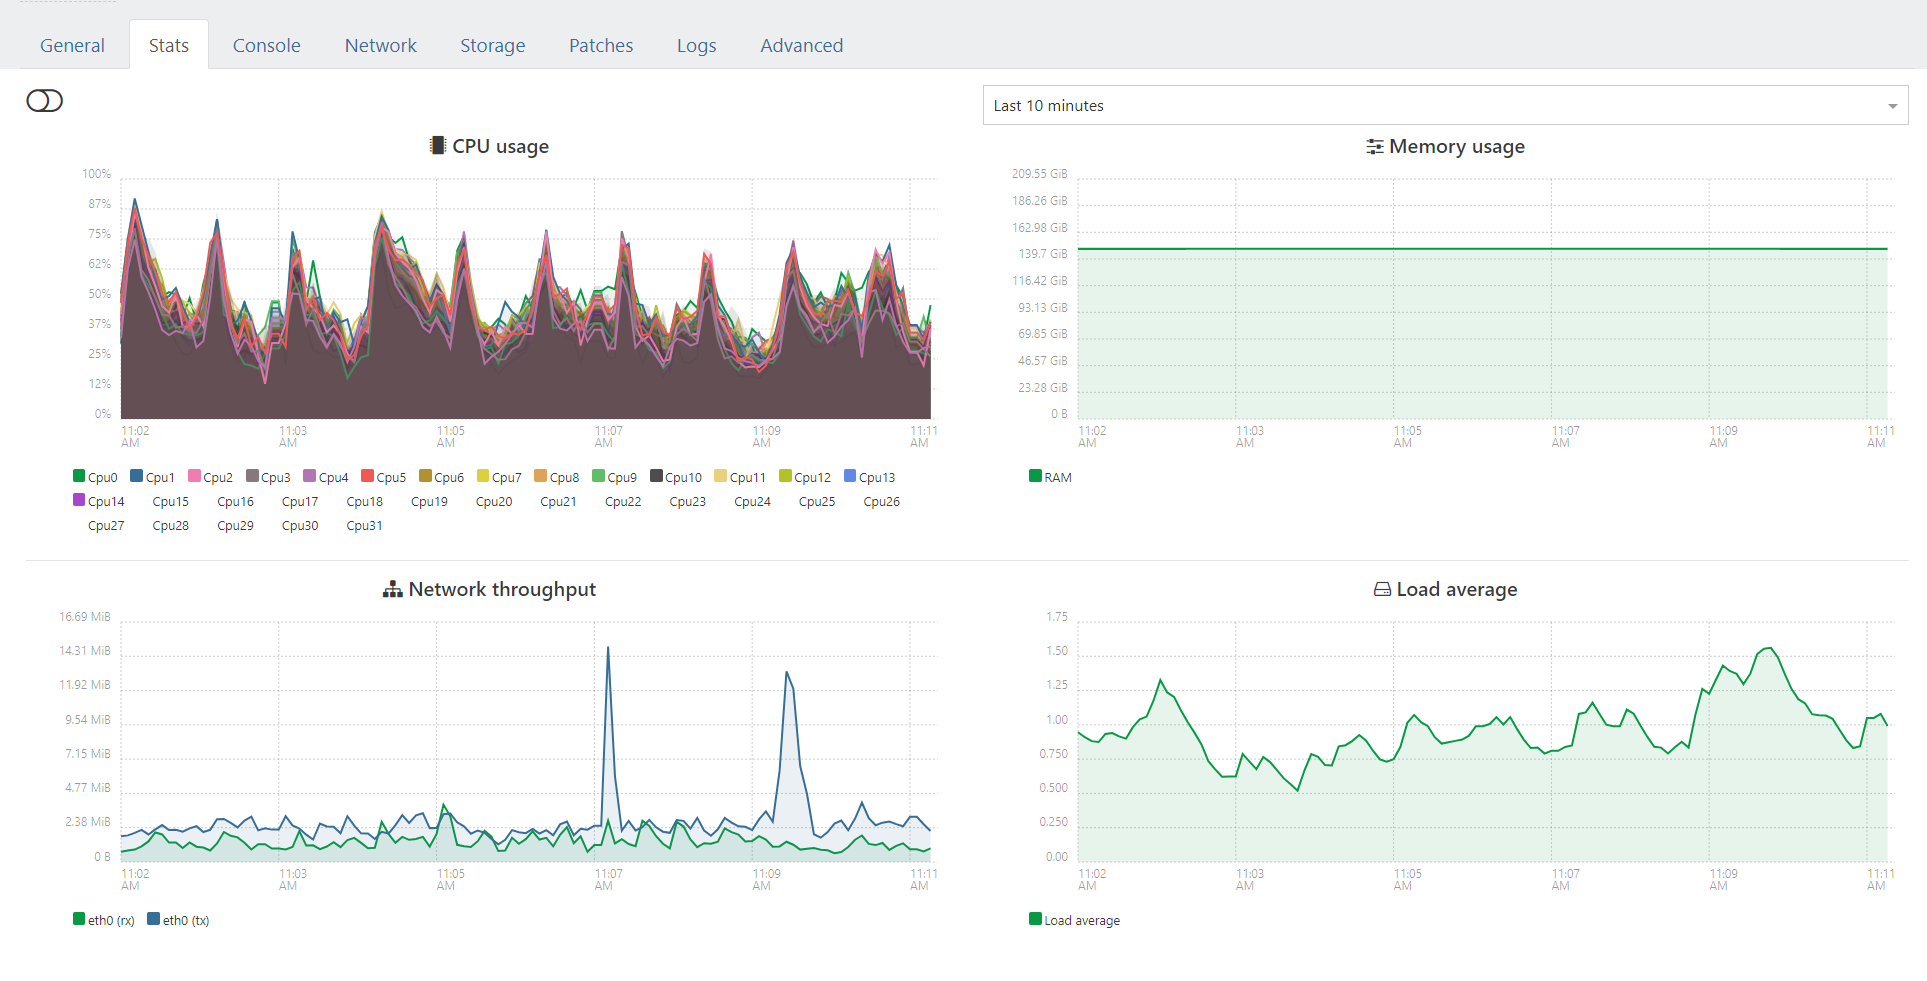
On Xen Orchestra graphs, the "CPU usage" graph is clearly below 100% (and even less as an average on the 10min shown). On the same time the sum of CPU % on xentop output is much less that 3200%.
But you wrote "You do have a pretty high CPU load". Where is this visible? Where is the high load seen according to above remarks? On the graphs?
Thank you very much for your help!
@olivierlambert said in Large "steal time" inside VMs but host CPU is not overloaded:
What's your vCPU/CPU ratio?
vCPU/CPU ratio is: 48/32
Thank you.
Thank you for your response.
I was under the impression that if CPUs are not overloaded then steal time is low.
I attach here some screenshots taken at the "same" time:
As seen in xentop screenshot, CPU load in total seems less that ~ 6 CPUs (600%),
That is on a host with 32 CPU threads.
But at the same time, steal time values is quite big ( like 40, 30, 25 ).
Is there something else worth noting for this case?
Thank you.


Hello,
this is a host running XCP-ng 8.3 on AMD Ryzen 9 7950X3D (16 cores, 32 CPU threads).
Inside VMs (all Linux VMs) the "top" command shows values in the range 15 to 30.
Inside Xen Orchestra host stats, CPU usage is in the range 1000% to 2500%.
Inside Xen Orchestra host stats, Load average is in the range 0.6 to 1.5
Seems like host CPUs are not saturated/overloaded, but the steal time values given in "top" are quite high.
Any ideas why this is happening?
Thank you.