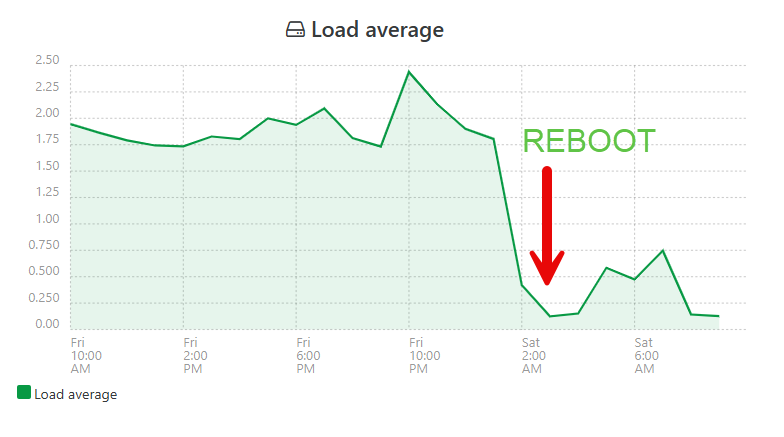
The problem I described got resolved some hours ago.
Indeed the steal time was not reasonable. It was not normal, it was not because of many demanding VMs running on the same host.
I am writing more here, because it might be related to some bug or another case.
Some findings and the very simple solution:
- We noticed from our VM monitors, that the enormous steal time started exactly at 20-Sep, but it was not like that before. On 20-Sep we did a hard/cold reboot on the host. Since then the steal time was very high.
- Runing
xentop on the host showed once in a while a very big value on CPU(%) for dom0. This was very strage.
- Running 'perf' on several VMs we were noticing that
pvclock_clocksource_read call was having the most CPU% above any other server task/call (this is on an AMD Ryzen host).
Magically, the solution was to reboot the host!
Since the problem started we had also installed updates on Xen/XCP-ng stack, but done only xe-toolstack-restart until now (running XCP-ng 8.3).
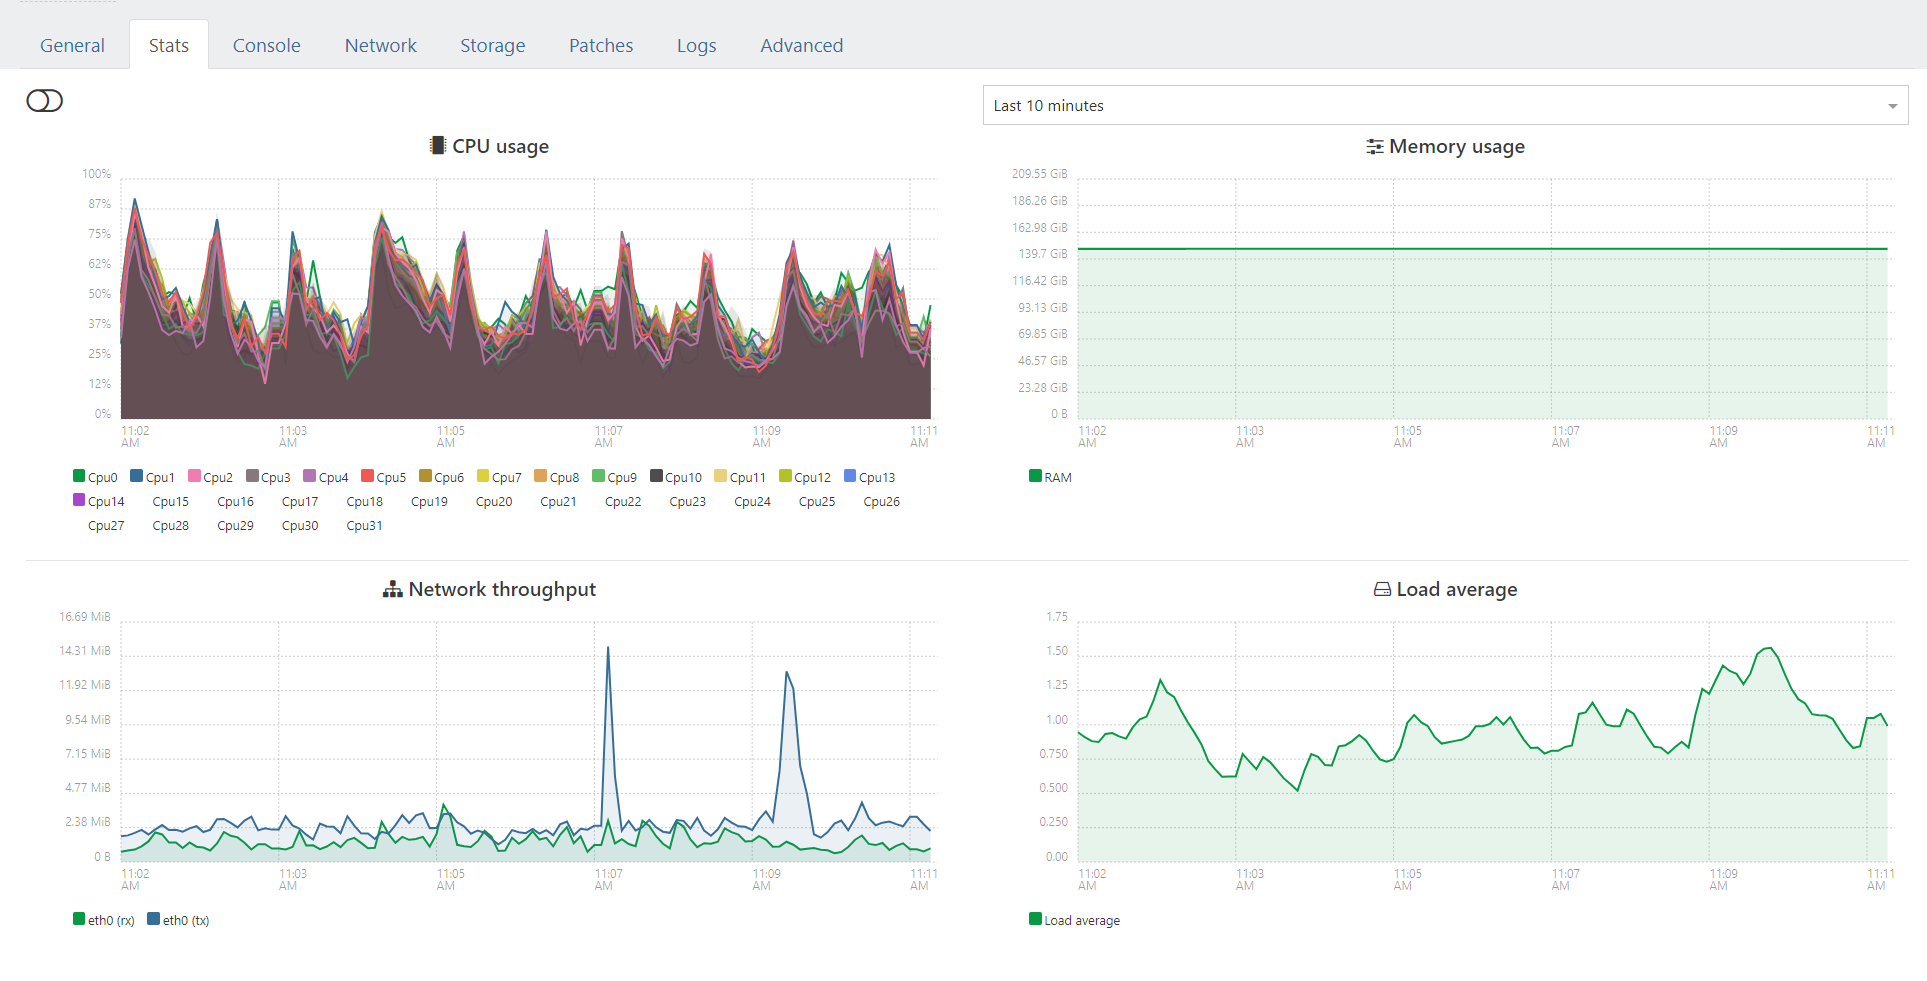
I am also attaching here some extra screenshots, please note the xentop output on last screenshot, the yellow painted row is Dom0. See the CPU(%). This was once every about 20 seconds showing a value like that. The value is so high that looks like an overflow or something.
-
The steal time graph on a random VM on this host. Showing the enormous steal time from 20-Sep until the resolution (reboot) some hours ago.

-
The "Load Average" graph inside XenOrchestra, showing a big drop after the reboot.

-
The screenshot of xentop I mentioned above showing the high CPU% value on Dom0 once in a while.
In my opinion this here might be saying something (if not a bug).


