log_fs_usage / /var/log directory on pool master filling up constantly
-
@bvitnik Thanks for your reply!
Yes, all of the XCP-ng hosts have been restarted since I started monitoring the /var/log directory due to package upgrades.
I also restarted the toolstack 2 or 3 times in the time frame so I think the issue was not caused by some sort of stuck process or similar.I did some research in this regard and also noticed that most people that have an environment of my scale do not encounter this issue (I currently have 105 VMs running).
So I also suspect that there is something unusual happening in my pool.I thought about circumventing this issue by implementing a remote syslog server (like graylog) that has enough storage and letting all my XCP-ng hosts write to it.
I would really prefer to fix the underlying issue though.Does anybody possibly know some common things that could cause this that I could check?
That would be really awesome.Thanks and best regards
-
I did some research and found 2 (old) forum threads where other people encountered the issue that I am currently facing (/var/log full after some time). 1 thread I found in this forum and the other one in Citrix Xenserver forum.
In both cases it was recommended to check for old / incompatible XenTools since appearently they can cause this exact behaviour of filling up /var/log on the pool master.
Appearently there even was a confirmed bug in one version of Citrix XenTools for this issue.My 105 virtual machines are all either Windows Server or Debian (mixed Debian 11, 12 and 13).
I am using these XenTools on most of my Debian systems (latest version): https://github.com/xenserver/xe-guest-utilities
I am using these XenTools on all of my Windows systems: "XenServer VM Tools for Windows 9.4.2", https://www.xenserver.com/downloadsAre those XenTools expected to cause issues? What are the XenTools expected to work best with fully updated XCP-ng 8.3 as of now?
Best regards
-
Hi, you are not the only one to have the problem.
We do as well and with a smaller environment in terms of physical hosts ( only 3).
I did not engage with support yet because the size has gone back under 90% on its own but it keep popping up any other day.
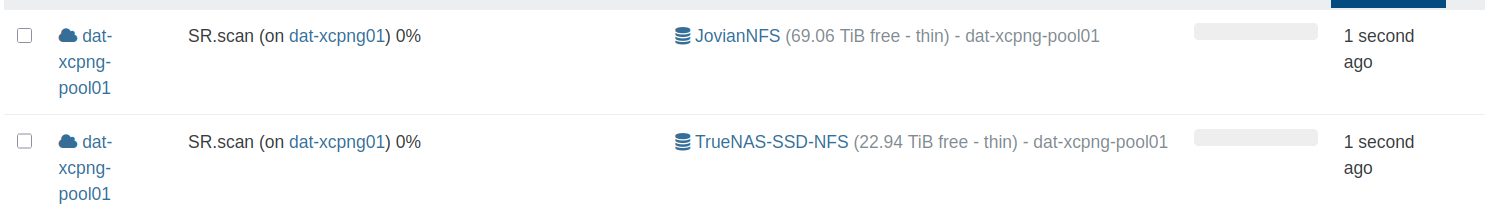
We have constanst sr.scan as well which in our case last for a long time and we have other issues as well at running task like starting or stopping VM but we haven't figured why yet.
-
One of our pools. (5 hosts, 6 NFS SRs) had this issue when we first deployed it. I engaged with support from Vates and they changed a setting that reduced the frequency of the SR.scan job from 30 seconds to every 2 mins instead. This totally fixed the issue for us going on a year and a half later.
I dug back in our documentation and found the command they gave us
xe host-param-set other-config:auto-scan-interval=120 uuid=<Host UUID>Where hosts UUID is your pool master.
-
@flakpyro said in log_fs_usage / /var/log directory on pool master filling up constantly:
One of our pools. (5 hosts, 6 NFS SRs) had this issue when we first deployed it. I engaged with support from Vates and they changed a setting that reduced the frequency of the SR.scan job from 30 seconds to every 2 mins instead. This totally fixed the issue for us going on a year and a half later.
I dug back in our documentation and found the command they gave us
xe host-param-set other-config:auto-scan-interval=120 uuid=<Host UUID>Where hosts UUID is your pool master.
Thank you very much for checking your documentation and sharing your fix!
I will try your approach on my pool master.Best regards
-
I applied
xe host-param-set other-config:auto-scan-interval=120 uuid=<Host UUID>on my pool master as suggested by @flakpyro and it had a direct impact on the frequency of SR.scan tasks popping up and the amount of log output!
I implemented graylog and remote syslog on my XCP-ng pool after posting the first message of this thread and in the image pasted below you can clearly see the effect of "auto-scan-interval" on the logging output.
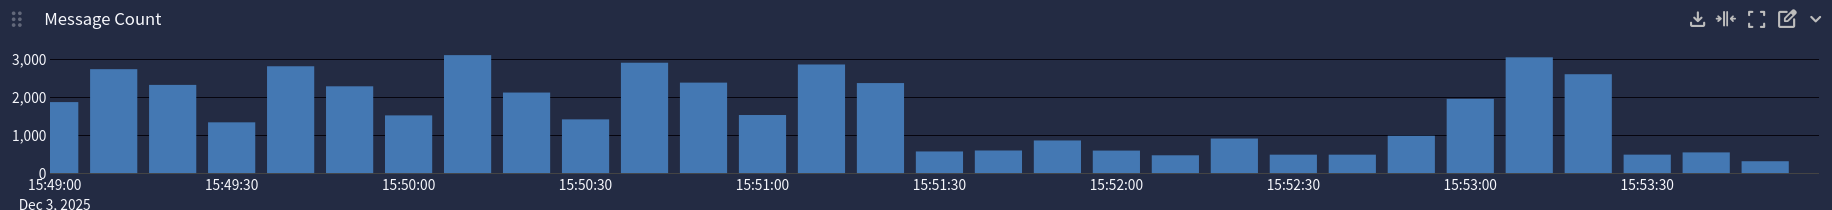
I will keep monitoring this but it seems to improve things quite substantially!
Since it appears that multiple users are affected by this it may be a good idea to change the default value within XCP-ng and/or add this to official documentation.
-
@MajorP93 said in log_fs_usage / /var/log directory on pool master filling up constantly:
will keep monitoring this but it seems to improve things quite substantially!
Since it appears that multiple users are affected by this it may be a good idea to change the default value within XCP-ng and/or add this to official documentation.
Reply
nice, but these SR scans have a purpose (when you create/extend an SR, to discover VDIs and ISOs, ...)
on the legitimacy of reducing the period, and the impact on logs, it should be better documented yeahxe host-param-set other-config:auto-scan-interval=120 uuid=<Host UUID>never saw this command line in the documentation, perhaps it should be there with full warnings ?
-
@Pilow correct me if I'm wrong but I think day-to-day operations like VM start/stop, SR attach, VDI create, etc. perform explicit storage calls anyway so they should not depend strongly on this periodic SR.scan which is why I considered applying this safe
-
@MajorP93 I guess so, if someone from Vates team get us the answer as why so frequently perhaps it will enlighten us
-
@Pilow agreed. This shouldn't be the norm. auto-scan-interval=120 is not going to be good for everyone. The majority of people probably don't have any problem with the default value, even in larger deployments.
On the other hand, the real cause of the issue is still elusive.
-
@bvitnik Not really,
what is elusive here is if we can reduce the auto scan frequency and why is set by default to frequent but that to cause the increase of logs is the auto scan is quite clear from MajorP93 test..
The auto scan log shows a lot of lines for each disks and when you have like 400 - 500 disks and you scan them every 30 seconds you definitely have a lot of logs.I think the log partition is quite small to be honest but the logs is also very chatty.
-
@denis.grilli I understand... but my experience is that even with the default scanning interval the logs become the problem when you get in the range of tens of SRs, thousands of disks. MajorP93's infra is quite small so I believe there is something additional that is spamming the logs... or there is some additional trigger for SR scan.
Update: maybe the default value changed in recent versions?
-
Well I am not entirely sure but in case the effect of SR.scan on logging gets amplified by the size of virtual disks aswell (in the addition to the number of virtual disks) it might be caused by that. I have a few virtual machines that have a) many disks (up to 9) and b) large disks.
I know it is rather bad design to run VMs this way (in my case these are file servers), I understand that using a NAS and mounting a share is better in this case but I had to migrate these VMs from the old environment and keep them running the way they are.
That is the only thing I could think of that could result in SR.scan having this big of an impact in my pool. -
@MajorP93 throw in multiple garbage collections during snap/desnap of backups on a XOSTOR SR, and these SR scans really get in the way
-
Another thing that I noticed: despite enabling remote syslog (to graylog) for all XCP-ng hosts in the pool /var/log gets filled up to 100%.
Adding remote syslog seem to not change usage of /var/log at all.Official XCP-ng documentation states otherwise here: https://docs.xcp-ng.org/installation/install-xcp-ng/#installation-on-usb-drives
The linked part of the documentation indicates that configuring remote syslog can be a possible solution for /var/log space constraints which seems to be not the case.
I feel like logging could use some investigation by Vates in general.
-
M MajorP93 referenced this topic on
-
Q1: Can I disable the auto-scan completely for a single SR?
That particular SR only contains block devices (disks) that I pass through directly to VMs. Those disks are > 2 TB and I'd love to put in standby when they are not in use. One of them is only used as a backup target within that VM and I've created a service that runshdparm -S 150 /dev/sdcin Dom0. Putting the disk in standby works, but the rescan wakes up that disk.Q2: If I can't disable rescans ofr individual SRs. Can I set the rescan interval to 86400 (once per day) on the whole host. Is there any negative effect in a homelab setting?
Q3: Does a manual "Rescan" on the SR trigger the same cleanup jobs (e.g. coalesce of snapshots), that the periodic scan does?
-
@gumbo2k I am not expert so I cannot give you an answer for sure but I would not disable the sr.scan completely, I feel like that could cause problems at some point.
Anyway, I don't think touching the scan is necessary anymore.
Vates has release many new updates for both XOA and xcp-ng and now the scan is very fast.
If you haven't done already I would suggest to upgrade your xcp-ng and re-test because now everything run smoothly and fast.
-
@denis.grilli The problem is not the performance of the scan ... the problem is, that this storage device only consists of block devices (disks) that should go into standby mode when not used ... but I think I've found a code line that checks if
other-configfor an SR containsauto-scan: false... I think ...
-
The
sr.scan-driven SMlog growth angle that gumbo2k surfaced is a real lead; there's some context in the storage-related log files reference, but the docs don't go as far as "here's how to throttle it safely on a pool where the underlying disks should spin down."Soft ping to @Team-Storage and @Team-Hypervisor-Kernel: could one of you weigh in on whether
other-config:auto-scan=falseon the SR is the supported way to reduce scan pressure, or if there's a better lever? I don't want to send anyone down a path that breaks an SR. Apologies if this has already been answered somewhere I haven't seen.
Hello! It looks like you're interested in this conversation, but you don't have an account yet.
Getting fed up of having to scroll through the same posts each visit? When you register for an account, you'll always come back to exactly where you were before, and choose to be notified of new replies (either via email, or push notification). You'll also be able to save bookmarks and upvote posts to show your appreciation to other community members.
With your input, this post could be even better 💗
Register Login