Large "steal time" inside VMs but host CPU is not overloaded
-
Yes, differential diagnosis is a good way to pinpoint the problem.
-
After some investigation I see that a lot of CPU cycles are given to
pvclock_clocksource_readcalls
(like 30%+ on a VM)Then I found some relevant discussions on clocksource and Xen and the benefit of tsc.
But seems that tsc is missing
On domU:
# cat /sys/devices/system/clocksource/clocksource0/available_clocksource
xen hpet acpi_pm
# cat /sys/devices/system/clocksource/clocksource0/current_clocksource xen(on dom0 the same as above)
And:
# dmesg | grep -i tsc
[    0.000000] [Firmware Bug]: TSC doesn't count with P0 frequency!
[    0.023407] tsc: Fast TSC calibration using PIT
[    0.023408] tsc: Detected 4192.045 MHz processor
[    0.023408] tsc: Detected 4192.168 MHz TSC
[    0.681699] clocksource: tsc-early: mask: 0xffffffffffffffff max_cycles: 0x3c6d7a8273c, max_idle_ns: 440795242263 ns
[    0.741364] clocksource: Switched to clocksource tsc-early
[    1.893775] clocksource: tsc: mask: 0xffffffffffffffff max_cycles: 0x3c6d7a8273c, max_idle_ns: 440795242263 ns
[    1.893845] clocksource: Switched to clocksource tsc
[509638.654338] clocksource: timekeeping watchdog on CPU1: Marking clocksource 'tsc' as unstable because the skew is too large:
[509638.654338] clocksource:                       'tsc' cs_now: 797578a475b6a cs_last: 79757086afc52 mask: ffffffffffffffff
[509638.654338] tsc: Marking TSC unstable due to clocksource watchdog
Is this normal? That the tsc is missing?
Is the hardware only related? If yes, are they usually any BIOS settings that can help having tsc?
Thank you.
-
Isn't tsc for Intel only CPUs? I only vaguely remember, maybe @andyhhp would give an answer in here
-
The problem I described got resolved some hours ago.
Indeed the steal time was not reasonable. It was not normal, it was not because of many demanding VMs running on the same host.
I am writing more here, because it might be related to some bug or another case.
Some findings and the very simple solution:
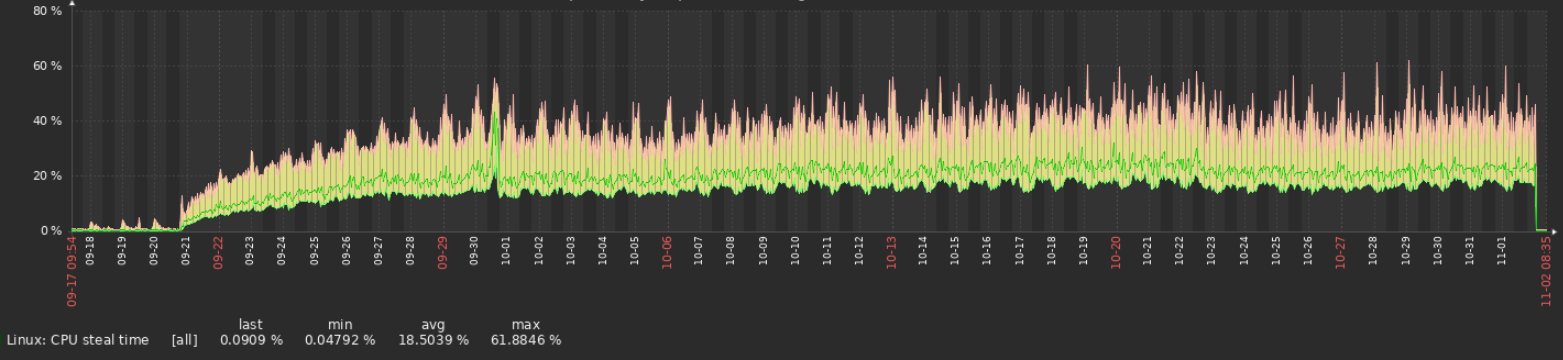
- We noticed from our VM monitors, that the enormous steal time started exactly at 20-Sep, but it was not like that before. On 20-Sep we did a hard/cold reboot on the host. Since then the steal time was very high.
- Runing
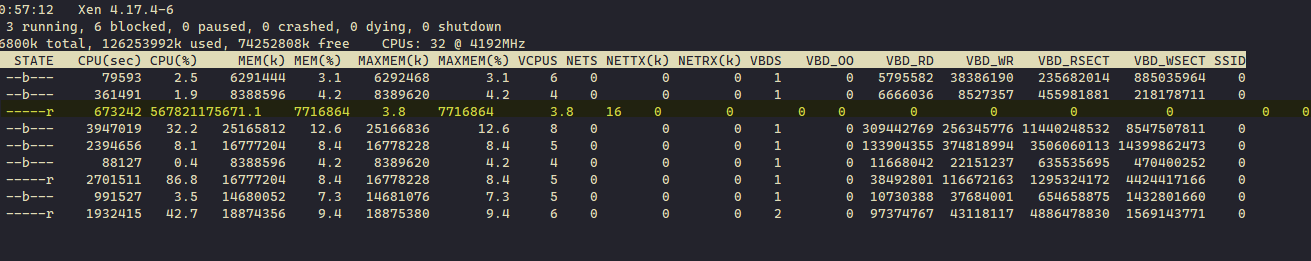
xentopon the host showed once in a while a very big value on CPU(%) for dom0. This was very strage. - Running 'perf' on several VMs we were noticing that
pvclock_clocksource_readcall was having the most CPU% above any other server task/call (this is on an AMD Ryzen host).
Magically, the solution was to reboot the host!
Since the problem started we had also installed updates on Xen/XCP-ng stack, but done only xe-toolstack-restart until now (running XCP-ng 8.3).
I am also attaching here some extra screenshots, please note the
xentopoutput on last screenshot, the yellow painted row is Dom0. See the CPU(%). This was once every about 20 seconds showing a value like that. The value is so high that looks like an overflow or something.-
The steal time graph on a random VM on this host. Showing the enormous steal time from 20-Sep until the resolution (reboot) some hours ago.
-
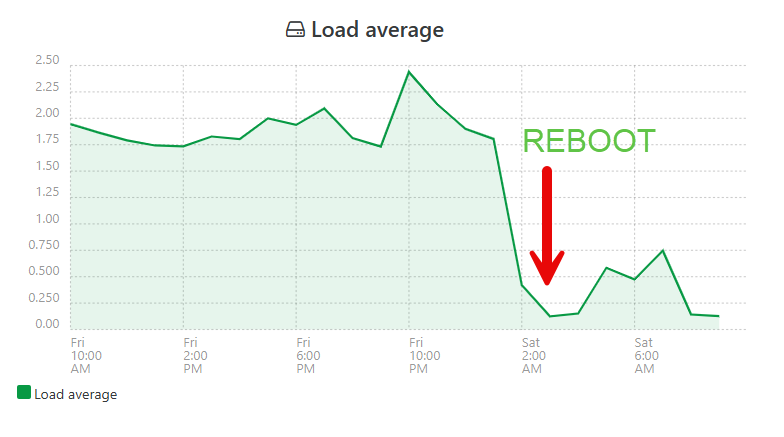
The "Load Average" graph inside XenOrchestra, showing a big drop after the reboot.
-
The screenshot of
xentopI mentioned above showing the high CPU% value on Dom0 once in a while.
In my opinion this here might be saying something (if not a bug).
-
Hey thank you very much for the feedback. That's weird, and that would be great if you could report if it goes again worse in the future (or maybe it was a bug fixed by an update).
Do you actually "feel" the difference in terms of VM performance for your services?
-
@olivierlambert Thank you!
Do you actually "feel" the difference in terms of VM performance for your services?
OF COURSE! Was very slow.
You cannot imagine the difference...This is an AMD Ryzen 9 7950X3D host.
Moreover, since the problem started we migrated several VMs to other hosts.
If you see the screenshots above, inxentopoutput, besides Dom0, all other VMs where like hardly using 2-3 CPUs in total.
And everything was dead slow (steal time always high).My feeling here is that this was somehow related to networking (tap*), but really don't know what and why.
Glad this was resolved after the reboot. -
This is an AMD Ryzen 9 7950X3D host.
@gecant, I'm picking up on your discussion again to ask another question about the 7950X3D with 16 CPU cores:
If I'm reading this correctly, this is an “asymmetric” CPU with 8 cores featuring 3D V-Cache technology and 8 standard cores for higher clock speeds. How does this work with dynamic allocation in XEN? Do you have any experience with this? Or do you assign domUs to specific cores? But if so, how do I know which cores are the performance cores?
That's a lot of questions, but basically, I'm just not entirely sure because XEN usually uses symmetric CPUs where all cores and threads deliver the same performance.
-
@lovvel Personally I would avoid assigning cores to domU without a very specific reason to do this, I prefer to have the kernel decide. Especially since we are talking about virtualization.
CPU 7950X3D indeed has 2 separate CCDs with different cache (per 8 cores) and different max clock speeds, but there are many factors when Xen also enters the field, especially regarding the max clock speed. I don't know if this is even possible on 7950X3D.
I know that my answer above might not exactly answer your questions.
-
@lovvel from a software standpoint, this is a 16 cores CPUs and AFAICT, Xen doesn't account for these slight differences between cores.
As to be fair, it's not really easy to know in practice if a 3D-VCache core will be faster than a non-3D-VCache one for a specific case.
-
Thanks for your feedback, @TeddyAstie and @gecant . From your answers and the discussion in Non-server CPU compatibility - Ryzen and Intel I conclude, that the benefits of the 8 V-cache cores vs. the 8 turbo cores are just irrelevant. For XEN they are transparent and not really different in terms of performance. Hence, in a typical server environment we just let XEN randomly choose the cores and don't think about different "performance cores" that COULD be faster in specific applications like games.
Hello! It looks like you're interested in this conversation, but you don't have an account yet.
Getting fed up of having to scroll through the same posts each visit? When you register for an account, you'll always come back to exactly where you were before, and choose to be notified of new replies (either via email, or push notification). You'll also be able to save bookmarks and upvote posts to show your appreciation to other community members.
With your input, this post could be even better 💗
Register Login