Every virtual machine I restart doesn't boot.
-
Hello,
Every virtual machine I restart doesn't boot. It just show VM.start: 33%. I did:
# xe-toolstack-restart
# service xapi restartBut, problem exit. All my servers went down.
What should I do?
Thank you.
-
@ohthisis hi, need more context...
seems to be a storage issue... do you have somethiong in LOGS tab of the VM and/or SR ?do you have any issue represented in DASHBOARD/HEALTH ?
what version of XCP / XO or XOA ?
-
@Pilow
I see :Headers Timeout ErrorNothing in the HEALTH and I use Xen Orchestra, commit 83a69 and:
[09:04 xcp-ng ~]# cat /etc/redhat-release XCP-ng release 8.2.1 (xenenterprise) -
@ohthisis how many hosts in the pool ?
is it shared or local storage for your VMs ?on cli on hosts try
# xl listand
# xenops-cli listreport back the results
-
@Pilow
I just have one host and I use local storage.[09:27 xcp-ng ~]# xl list Name ID Mem VCPUs State Time(s) Domain-0 0 5936 16 r----- 18024910.4 XO 72 4096 2 -b---- 8899359.6 Grafana 114 16383 1 --psr- 2983554.9 Tor 156 2039 1 --p--- 0.0 [09:28 xcp-ng ~]# xenops-cli list Name ID Mem VCPUs State Time(s) Tor - 2048 4 Paused Grafana - 16384 4 Paused XO 72 4096 2 Running -
@ohthisis you confirm that your 2 VMs Grafana and Tor are paused in web UI ?
if not, tryxe vm-reset-powerstate uuid=<uuid_of_vm> force=trueand do a restart toolstack afterward
-
@Pilow
Doesn't work. It just show VM.start: 33%
I'm afraid to restart the server too because the XO will not run also. -
I don't know what happened.
-
@ohthisis the --psr- state of Grafana is suspicious...
0.0 in Time column for Tor toodid you have a brutal reboot / power loss of this server ?
is your storage OK ?there is some commands to brutally kill all VM in hybrid states like that, but could corrupt data inside (like a forced hard shutdown would do)
do you have backups of your VMs ?
# xl destroy 114This command would kill the domain runtime (hard shutdown) of Grafana VM
it would then disappear of xl list
followed by a toolstack restart, should present you an halted VM in web UI that potentially could be started normally if no other issue on storage existsbut :
- i do not recommend this action if your storage currently have issues
- i do not recommend this action if you do not have backups
- i do not recommend this action, it could corrupt data inside the VM (it is paused.. but is it really ?!)
just noticed you do not have same vCPUs on VMs with each command.
there is a real desync in your system
-
@Pilow
Please take a look at these:[09:08 xcp-ng ~]# df -h Filesystem Size Used Avail Use% Mounted on devtmpfs 2.8G 20K 2.8G 1% /dev tmpfs 2.8G 160K 2.8G 1% /dev/shm tmpfs 2.8G 11M 2.8G 1% /run tmpfs 2.8G 0 2.8G 0% /sys/fs/cgroup /dev/sda1 18G 2.0G 15G 12% / xenstore 2.8G 0 2.8G 0% /var/lib/xenstored /dev/sda5 3.9G 836M 2.8G 23% /var/log tmpfs 571M 0 571M 0% /run/user/0 [09:17 xcp-ng ~]# mount | grep -E "(\/var|\/opt)" xenstore on /var/lib/xenstored type tmpfs (rw,relatime,mode=755) /dev/sda5 on /var/log type ext3 (rw,relatime) sunrpc on /var/lib/nfs/rpc_pipefs type rpc_pipefs (rw,relatime) [09:18 xcp-ng ~]# dmesg | grep -iE "(error|fail|timeout|scsi|sd|hba)" | tail -20 [81734324.210688] Status code returned 0xc000006d NT_STATUS_LOGON_FAILURE [81734324.217399] Status code returned 0xc000006d NT_STATUS_LOGON_FAILURE [81734324.223994] Status code returned 0xc000006d NT_STATUS_LOGON_FAILURE [81734324.230647] Status code returned 0xc000006d NT_STATUS_LOGON_FAILURE [81734324.237867] Status code returned 0xc000006d NT_STATUS_LOGON_FAILURE [81734324.244529] Status code returned 0xc000006d NT_STATUS_LOGON_FAILURE [81734324.251239] Status code returned 0xc000006d NT_STATUS_LOGON_FAILURE [81734324.257781] Status code returned 0xc000006d NT_STATUS_LOGON_FAILURE [81734324.264466] Status code returned 0xc000006d NT_STATUS_LOGON_FAILURE [81734324.270941] Status code returned 0xc000006d NT_STATUS_LOGON_FAILURE [81734324.277574] Status code returned 0xc000006d NT_STATUS_LOGON_FAILURE [81734324.284149] Status code returned 0xc000006d NT_STATUS_LOGON_FAILURE [81734324.290576] Status code returned 0xc000006d NT_STATUS_LOGON_FAILURE [81734324.297118] Status code returned 0xc000006d NT_STATUS_LOGON_FAILURE [81734324.306270] Status code returned 0xc000006d NT_STATUS_LOGON_FAILURE [81734324.314061] Status code returned 0xc000006d NT_STATUS_LOGON_FAILURE [81734324.322632] Status code returned 0xc000006d NT_STATUS_LOGON_FAILURE [81734324.330717] Status code returned 0xc000006d NT_STATUS_LOGON_FAILURE [81734324.337242] Status code returned 0xc000006d NT_STATUS_LOGON_FAILURE [81734324.344686] Status code returned 0xc000006d NT_STATUS_LOGON_FAILURE [09:18 xcp-ng ~]# pvs PV VG Fmt Attr PSize PFree /dev/sda3 VG_XenStorage-00f82a18-a9f6-f7bc-9ca1-f42698d46b5f lvm2 a-- 95.18g <95.18g /dev/sdb VG_XenStorage-c5129868-a590-68ca-e587-db708ad61f38 lvm2 a-- <3.64t 3.09t [09:18 xcp-ng ~]# vgs VG #PV #LV #SN Attr VSize VFree VG_XenStorage-00f82a18-a9f6-f7bc-9ca1-f42698d46b5f 1 1 0 wz--n- 95.18g <95.18g VG_XenStorage-c5129868-a590-68ca-e587-db708ad61f38 1 8 0 wz--n- <3.64t 3.09t [09:18 xcp-ng ~]# lvs -o lv_name,vg_name,lv_size,lv_attr LV VG LSize Attr MGT VG_XenStorage-00f82a18-a9f6-f7bc-9ca1-f42698d46b5f 4.00m -wi-a----- MGT VG_XenStorage-c5129868-a590-68ca-e587-db708ad61f38 4.00m -wi-a----- VHD-1461c885-89c6-4e0e-8ee1-7d5be059f3dc VG_XenStorage-c5129868-a590-68ca-e587-db708ad61f38 <30.07g -wi------- VHD-2aaa4501-1c9b-48d6-8532-961ab8a3e627 VG_XenStorage-c5129868-a590-68ca-e587-db708ad61f38 <30.07g -wi-ao---- VHD-4de5831d-5a4d-4d2d-9f0a-ce4d1c2d8ef5 VG_XenStorage-c5129868-a590-68ca-e587-db708ad61f38 100.20g -wi-a----- VHD-6b1ea821-d677-4426-99e0-43314ef3c536 VG_XenStorage-c5129868-a590-68ca-e587-db708ad61f38 <250.50g -wi-ao---- VHD-6c08ae7f-71a7-4f97-a553-3c067dbbe243 VG_XenStorage-c5129868-a590-68ca-e587-db708ad61f38 <50.11g -wi-a----- VHD-bc8dd3e4-ea0e-4006-a918-817b18d65456 VG_XenStorage-c5129868-a590-68ca-e587-db708ad61f38 <50.11g -wi-ao---- VHD-ccaaabb0-b5ae-4e29-ab8d-c895af000550 VG_XenStorage-c5129868-a590-68ca-e587-db708ad61f38 <50.11g -wi-a----- [09:18 xcp-ng ~]# lvdisplay /dev/VG_XenStorage-c5129868-a590-68ca-e587-db708ad61f38/VHD-ccaaabb0-b5ae-4e29-ab8d-c895af000550 --- Logical volume --- LV Path /dev/VG_XenStorage-c5129868-a590-68ca-e587-db708ad61f38/VHD-ccaaabb0-b5ae-4e29-ab8d-c895af000550 LV Name VHD-ccaaabb0-b5ae-4e29-ab8d-c895af000550 VG Name VG_XenStorage-c5129868-a590-68ca-e587-db708ad61f38 LV UUID TggCle-7H7d-BN1o-KU5U-8oME-lckS-z0puvZ LV Write Access read/write LV Creation host, time xcp-ng, 2023-07-11 14:19:40 +0330 LV Status available # open 0 LV Size <50.11 GiB Current LE 12827 Segments 1 Allocation inherit Read ahead sectors auto - currently set to 256 Block device 253:2 -
@ohthisis I see nothing outstanding
you have two SRs, thick provisionned
one small 95Gb that is empty probably created on the install, and one big 3.64Tb on /dev/sdbVMs are on the big SR, same sized VDIs could indicate existing snapshots.
is your /dev/sdb a RAID5 array or a standlone disk ?
Can you create a new test VM, that is running normally on this SR ?
-
@Pilow
I guess my server using RAID5.
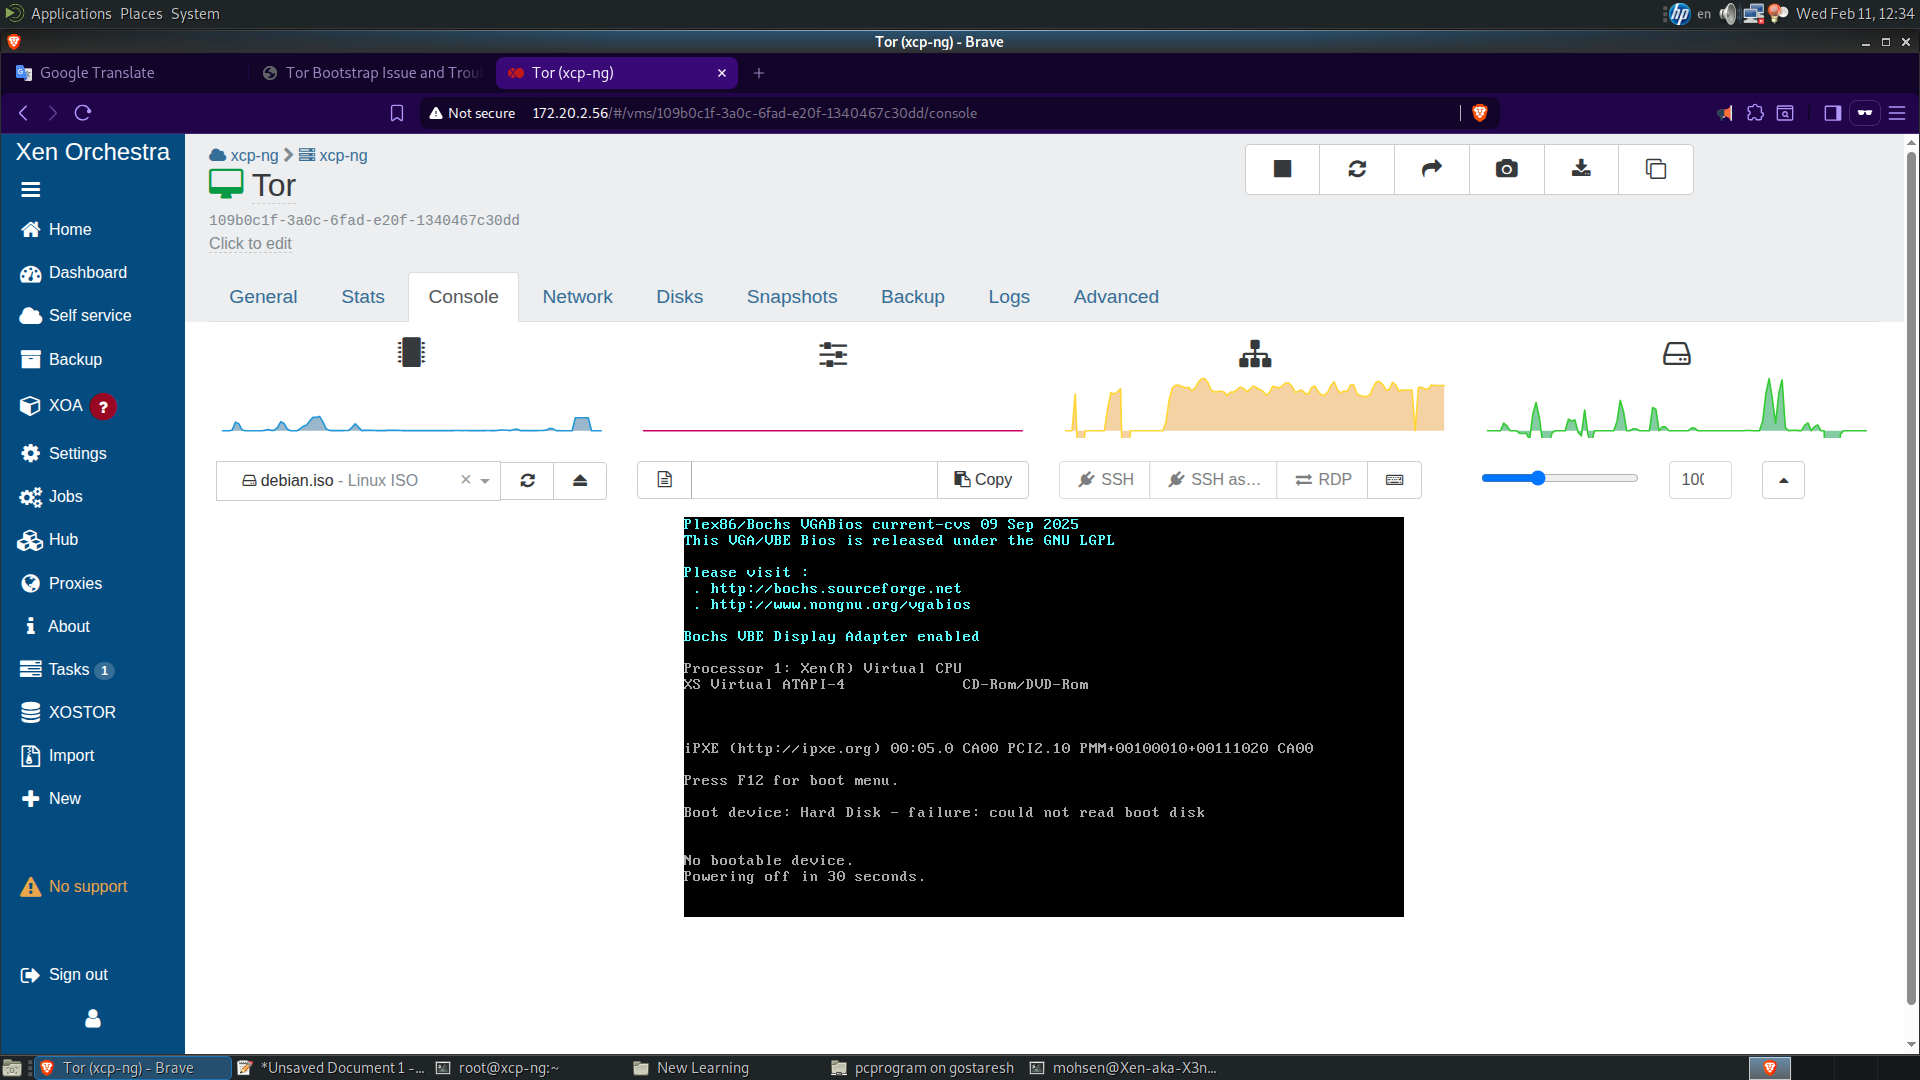
I created a VM with PXE as boot, but it is VM.start: 50%. -
-
I rebooted the server and now I got: