Negative values for CPU usage (graph)
-
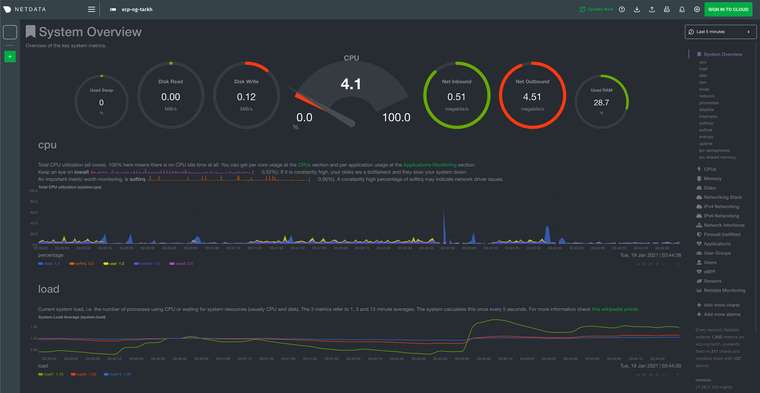
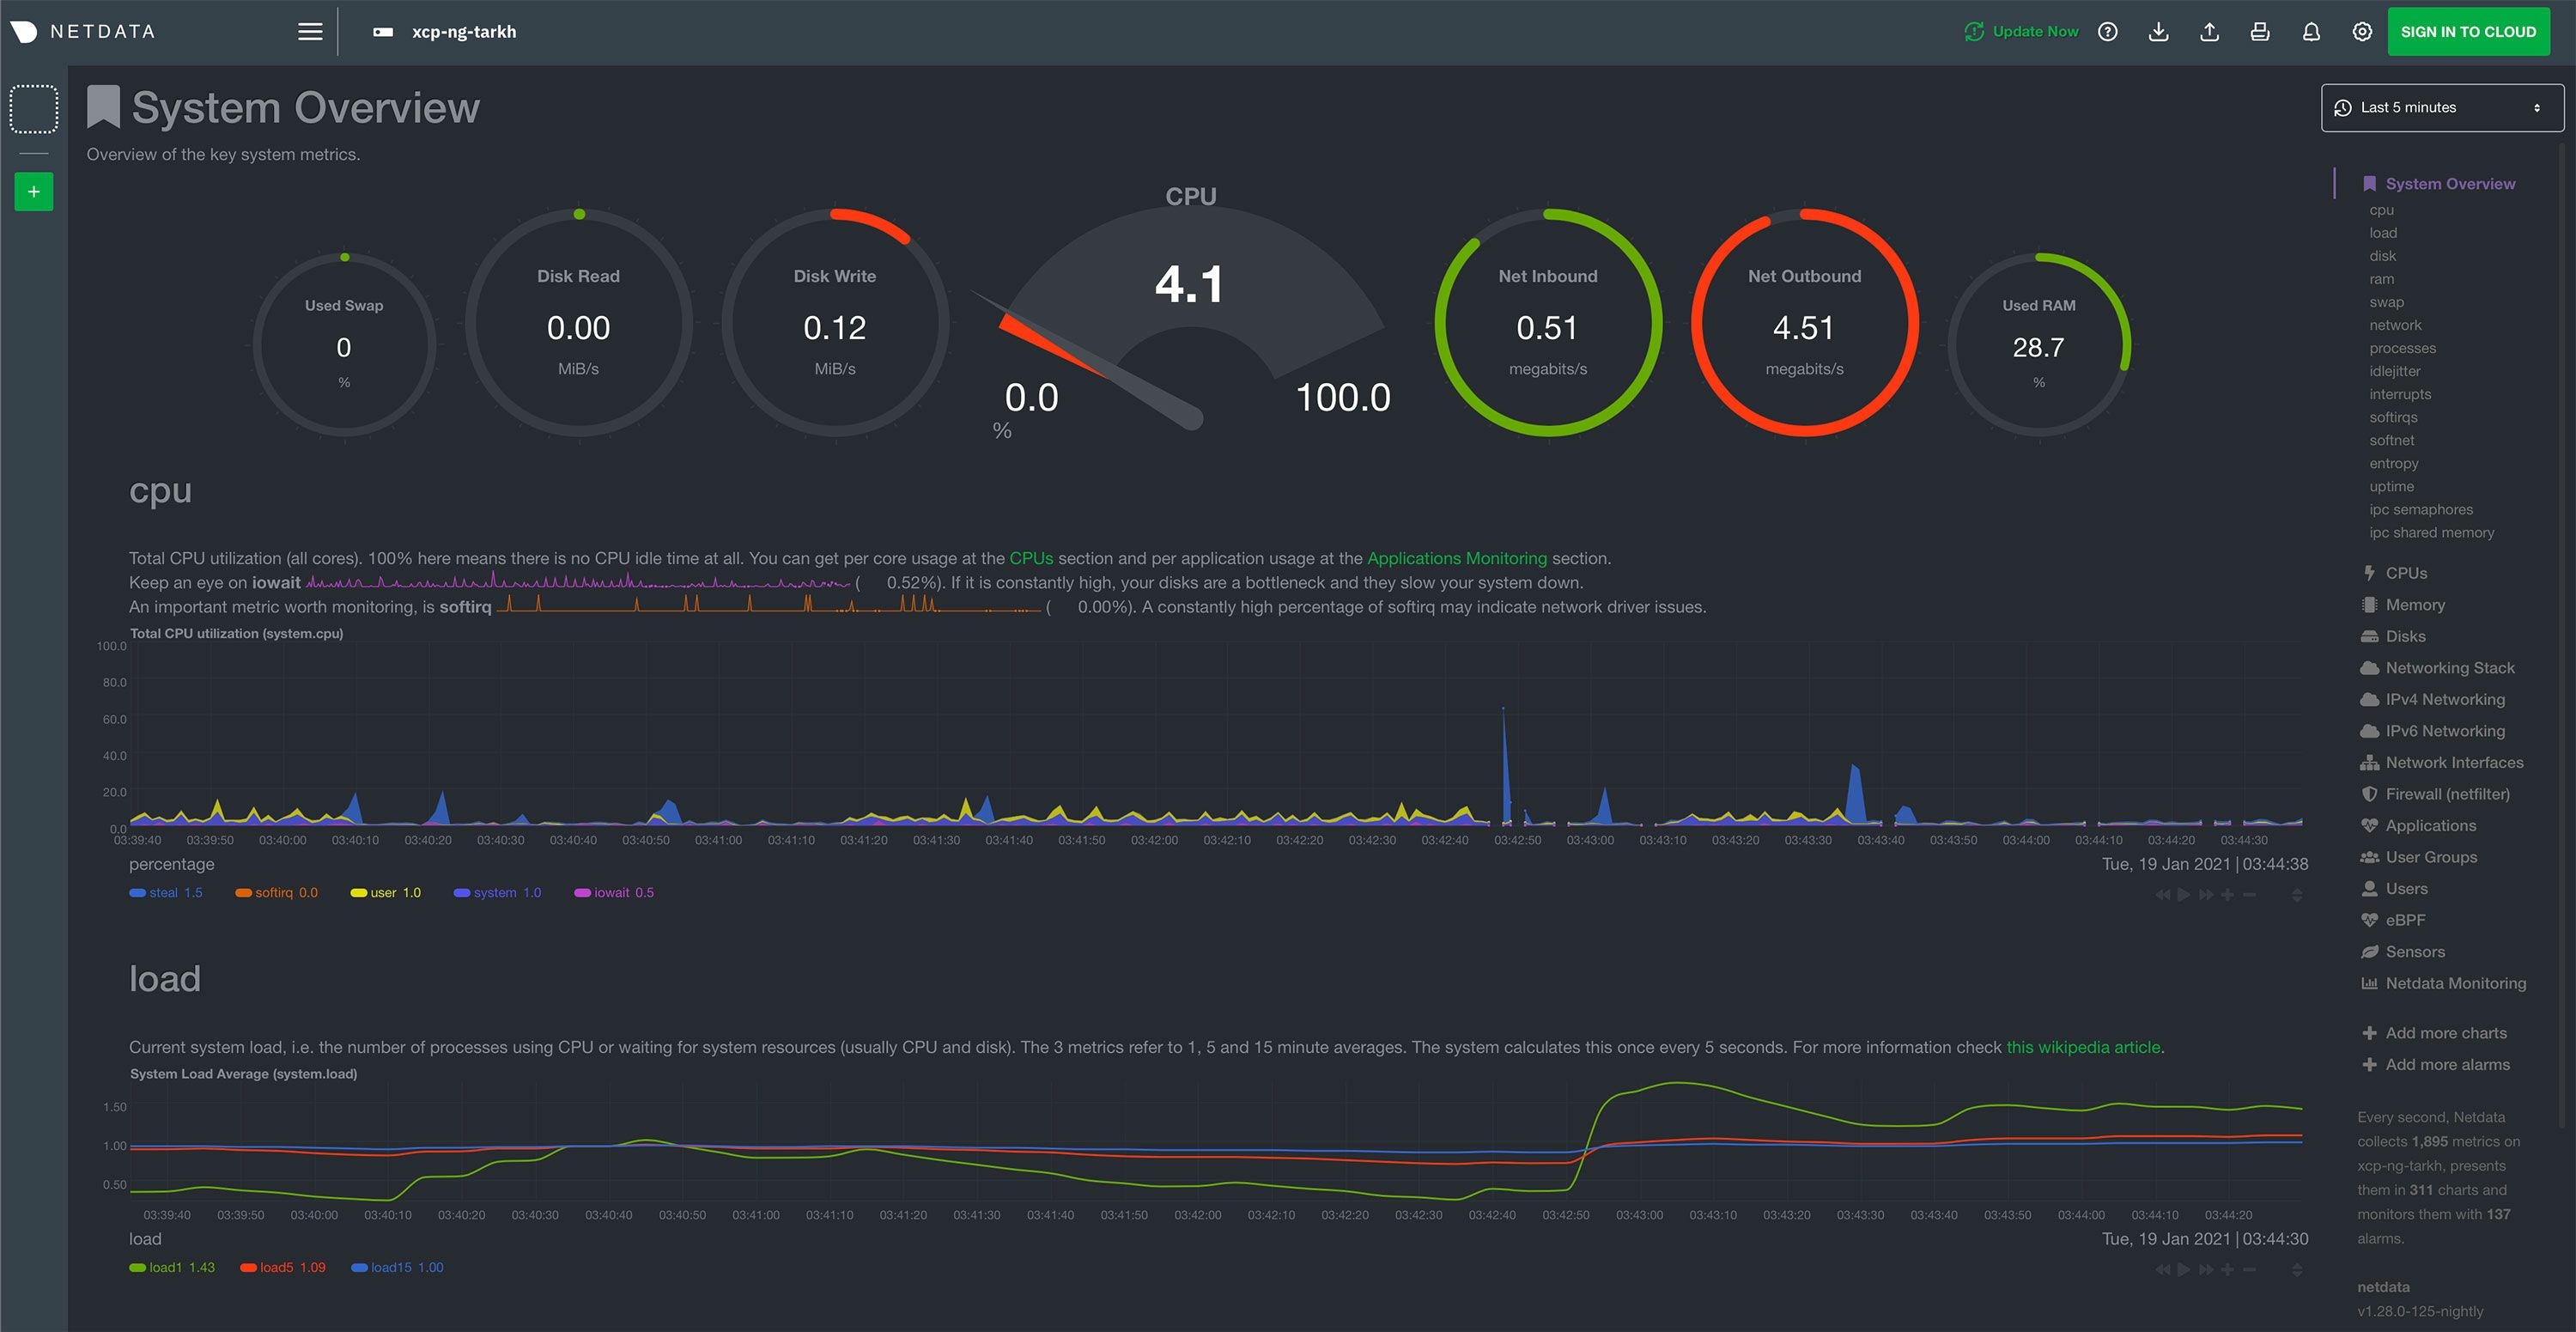
Hi, guys! I have strange behaviour in Xen Orchestra - on host CPU usage graph (and sometimes on VM also, but really not that frequently) values goes to negative. Attaching screenshots. In Netdata UI everything seems to be fine. Where to dig? Thanx!


-
That's weird. Hard to tell if there's strange values coming from XAPI RRDs or if it's the chart lib in XO.
-
Now you mention it.... I've seen this too and on Disk throughput.
-
Because this happens on my machine constantly, I can do some debugging/tests, just give me instructions.
-
@badrAZ might help you on how to see the values and see more about those data.
-
-
xo-cli host.stats host=
Ok, here is output of this command (I've trimmed CPU section). I can see negative values on some CPUs.
"cpus": { ... "8": [ 4.55, 4.55, 5.93, -10.639999999999999, -6.2700000000000005, 2.1399999999999997, 0.9199999999999999, 1.4000000000000001, 12.3, 14.14, -16.07, 8.76, 20.05, -18.98, 2.6100000000000003, 2.79, 2.31, 2.34, 2.88, 4.8500000000000005, 3.1300000000000003, 4.68, 3.9800000000000004, 3.9800000000000004, 24.36, -16.42, 2.26, 5.5, 2.44, 1.16, 4.26, 6.3100000000000005, 9.1, 6.859999999999999, 6, 3.42, 2.34, 2.25, 1.46, 5.18, 2.7, 3.92, 5.3100000000000005, 6.909999999999999, 7.88, 3.6900000000000004, 5.19, 3.92, 5.609999999999999, 6.800000000000001, 5.609999999999999, 5.3, 5.7700000000000005, 6.0600000000000005, 6.660000000000001, 6.21, 5.99, 5.58, 1.82, -0.03, 3.2399999999999998, 5.74, 6.1, 6.52, 6.59, 6.69, 18.18, 5.47, -14.74, 10.03, 14.44, -16.5, 1.37, 0.7100000000000001, -0.01, 5.71, 12.620000000000001, 12.620000000000001, -26.369999999999997, -0.59, 3.19, 1.78, 1.27, 0.04, 24.65, -18.81, -2.79, 7.3, 0.86, 0.96, 6.819999999999999, 6.419999999999999, 6, 6.3, 6.529999999999999, 6.34, 5.8999999999999995, 6.619999999999999, 19.72, 6.38, -10.7, 4.22, 3.74, 2.55, -1.01, -0.24, 1.05, 1.6, 2.76, 5.93, 2.97, 0.9299999999999999, 1.73, 4.18, 6.13, 5.7, 3.9600000000000004, 4.8, 7.6899999999999995 ], ... } -
Please give me the resulted file of this command:
wget http://<user>:<password>@<host>/rrd_updates?interval=5\&json=true\&start=$(($(date +%s) - 595)) -
Thank you for your time, I think I finally fixed it. This is how:
First time I've installed XO from this guide: https://github.com/ronivay/XenOrchestraInstallerUpdater
I used Appliance version - prebuilt VM with XO installed. And there was a problem with negative values.Now I've tried this guide: https://github.com/Jarli01/xenorchestra_updater
And instead of using prebuilt VM version, I ran Installation script on previously created Debian 10 VM. After script finish installing XO and all necessary libraries/dependencies, I've all telemetry working properly.
Hello! It looks like you're interested in this conversation, but you don't have an account yet.
Getting fed up of having to scroll through the same posts each visit? When you register for an account, you'll always come back to exactly where you were before, and choose to be notified of new replies (either via email, or push notification). You'll also be able to save bookmarks and upvote posts to show your appreciation to other community members.
With your input, this post could be even better 💗
Register Login
