is there a way (cli) to get the current health (lifetime) of an internal host ssd?
-
All in the subject
")
I wonder if I can get this info from xcpng.
-
IIRC, we exposed SMART info, but @AtaxyaNetwork might remember more than me the details

-
@manilx Hi !
I wrote a XAPI plugin for smartctl a while ago. You can use it like this:# Get all the info [18:06 Chouffe plugins]# xe host-call-plugin host-uuid=8b80bcc2-d31c-4f7d-85a7-e921f67c4ec5 plugin=smartctl.py fn=check_smartctl {"/dev/sdf": {"power_on_time": {"hours": 9147}, "ata_version": {"minor_value": 94, "string": "ACS-4 T13/BSR INCITS 529 revision 5", "major_value": 2556}, "form_factor": {"ata_value": 3, "name": "2.5 inches"}, "firmware_version": "SVQ02B6Q", "wwn": {"oui": 9528, "naa": 5, "id": 65536604056}, "smart_status": {"passed": true}, "smartctl": {"build_info": "(local build)", "exit_status": 0, "argv": ["smartctl", "-j", "-a", "/dev/sdf"], "version": [7, 0], "svn_revision": "4883", "platform_info": "x86_64-linux-4.19.0+1"}, "temperature": {"current": 32}, "rotation_rate": 0, } # get health status [18:06 Chouffe plugins]# xe host-call-plugin host-uuid=8b80bcc2-d31c-4f7d-85a7-e921f67c4ec5 plugin=smartctl.py fn=check_health {"/dev/sdf": "PASSED", "/dev/sdg": "PASSED", "/dev/sdd": "PASSED", "/dev/sde": "PASSED", "/dev/sdb": "PASSED", "/dev/sdc": "PASSED", "/dev/sda": "PASSED"} `` -
@AtaxyaNetwork Hi,
tried but get this:
Error code: UNKNOWN_XENAPI_PLUGIN_FUNCTION
Error parameters: check_smartctl
Running 8.3 beta
-
@manilx Try:
xe host-call-plugin host-uuid=<uuid> plugin=smartctl.py fn=information
xe host-call-plugin host-uuid=<uuid>  plugin=smartctl.py fn=health
We changed the name between my test and the real plugin on xcp-ng
-
@AtaxyaNetwork Better:
[10:19 vp6670 ~]# xe host-call-plugin host-uuid=bf2761ed-a851-4034-9cee-2b698509d46a plugin=smartctl.py fn=information
{"/dev/nvme0": {"smart_status": {"nvme": {"value": 0}, "passed": true}, "nvme_controller_id": 1, "smartctl": {"build_info": "(local build)", "exit_status": 0, "argv": ["smartctl", "-j", "-a", "/dev/nvme0"], "version": [7, 0], "svn_revision": "4883", "platform_info": "x86_64-linux-4.19.0+1"}, "temperature": {"current": 52}, "power_on_time": {"hours": 2796}, "power_cycle_count": 45, "nvme_smart_health_information_log": {"controller_busy_time": 47870, "host_writes": 624907017, "temperature": 52, "critical_comp_time": 9175, "available_spare": 100, "host_reads": 752263796, "data_units_written": 47041497, "power_on_hours": 2796, "num_err_log_entries": 0, "critical_warning": 0, "power_cycles": 45, "warning_temp_time": 76230, "percentage_used": 3, "available_spare_threshold": 10, "media_errors": 0, "data_units_read": 74276500, "unsafe_shutdowns": 5}, "logical_block_size": 512, "nvme_number_of_namespaces": 1, "user_capacity": {"bytes": 1000204886016, "blocks": 1953525168}, "nvme_namespaces": [{"capacity": {"bytes": 1000204886016, "blocks": 1953525168}, "utilization": {"bytes": 1000204886016, "blocks": 1953525168}, "formatted_lba_size": 512, "eui64": {"oui": 9911, "ext_id": 516855111029}, "id": 1, "size": {"bytes": 1000204886016, "blocks": 1953525168}}], "nvme_ieee_oui_identifier": 9911, "json_format_version": [1, 0], "nvme_pci_vendor": {"id": 9798, "subsystem_id": 9798}, "device": {"protocol": "NVMe", "type": "nvme", "name": "/dev/nvme0", "info_name": "/dev/nvme0"}, "serial_number": "50026B77856F71D7", "firmware_version": "SBM02103", "model_name": "KINGSTON SNV2S1000G", "local_time": {"time_t": 1720084783, "asctime": "Thu Jul  4 10:19:43 2024 WEST"}}, "/dev/sda": {"power_on_time": {"hours": 12570}, "ata_version": {"minor_value": 94, "string": "ACS-4 T13/BSR INCITS 529 revision 5", "major_value": 2556}, "form_factor": {"ata_value": 3, "name": "2.5 inches"}, "firmware_version": "SVQ02B6Q", "wwn": {"oui": 9528, "naa": 5, "id": 65526876152}, "smart_status": {"passed": true}, "smartctl": {"build_info": "(local build)", "exit_status": 0, "argv": ["smartctl", "-j", "-a", "/dev/sda"], "version": [7, 0], "svn_revision": "4883", "platform_info": "x86_64-linux-4.19.0+1"}, "temperature": {"current": 51}, "rotation_rate": 0, "interface_speed": {"current": {"sata_value": 3, "units_per_second": 60, "string": "6.0 Gb/s", "bits_per_unit": 100000000}, "max": {"sata_value": 14, "units_per_second": 60, "string": "6.0 Gb/s", "bits_per_unit": 100000000}}, "user_capacity": {"bytes": 1000204886016, "blocks": 1953525168}, "ata_smart_attributes": {"table": [{"name": "Reallocated_Sector_Ct", "flags": {"error_rate": false, "string": "PO--CK ", "event_count": true, "value": 51, "updated_online": true, "performance": false, "auto_keep": true, "prefailure": true}, "value": 100, "raw": {"string": "0", "value": 0}, "thresh": 10, "when_failed": "", "worst": 100, "id": 5}, {"name": "Power_On_Hours", "flags": {"error_rate": false, "string": "-O--CK ", "event_count": true, "value": 50, "updated_online": true, "performance": false, "auto_keep": true, "prefailure": false}, "value": 97, "raw": {"string": "12570", "value": 12570}, "thresh": 0, "when_failed": "", "worst": 97, "id": 9}, {"name": "Power_Cycle_Count", "flags": {"error_rate": false, "string": "-O--CK ", "event_count": true, "value": 50, "updated_online": true, "performance": false, "auto_keep": true, "prefailure": false}, "value": 99, "raw": {"string": "87", "value": 87}, "thresh": 0, "when_failed": "", "worst": 99, "id": 12}, {"name": "Wear_Leveling_Count", "flags": {"error_rate": false, "string": "PO--C- ", "event_count": true, "value": 19, "updated_online": true, "performance": false, "auto_keep": false, "prefailure": true}, "value": 98, "raw": {"string": "11", "value": 11}, "thresh": 0, "when_failed": "", "worst": 98, "id": 177}, {"name": "Used_Rsvd_Blk_Cnt_Tot", "flags": {"error_rate": false, "string": "PO--C- ", "event_count": true, "value": 19, "updated_online": true, "performance": false, "auto_keep": false, "prefailure": true}, "value": 100, "raw": {"string": "0", "value": 0}, "thresh": 10, "when_failed": "", "worst": 100, "id": 179}, {"name": "Program_Fail_Cnt_Total", "flags": {"error_rate": false, "string": "-O--CK ", "event_count": true, "value": 50, "updated_online": true, "performance": false, "auto_keep": true, "prefailure": false}, "value": 100, "raw": {"string": "0", "value": 0}, "thresh": 10, "when_failed": "", "worst": 100, "id": 181}, {"name": "Erase_Fail_Count_Total", "flags": {"error_rate": false, "string": "-O--CK ", "event_count": true, "value": 50, "updated_online": true, "performance": false, "auto_keep": true, "prefailure": false}, "value": 100, "raw": {"string": "0", "value": 0}, "thresh": 10, "when_failed": "", "worst": 100, "id": 182}, {"name": "Runtime_Bad_Block", "flags": {"error_rate": false, "string": "PO--C- ", "event_count": true, "value": 19, "updated_online": true, "performance": false, "auto_keep": false, "prefailure": true}, "value": 100, "raw": {"string": "0", "value": 0}, "thresh": 10, "when_failed": "", "worst": 100, "id": 183}, {"name": "Reported_Uncorrect", "flags": {"error_rate": false, "string": "-O--CK ", "event_count": true, "value": 50, "updated_online": true, "performance": false, "auto_keep": true, "prefailure": false}, "value": 100, "raw": {"string": "0", "value": 0}, "thresh": 0, "when_failed": "", "worst": 100, "id": 187}, {"name": "Airflow_Temperature_Cel", "flags": {"error_rate": false, "string": "-O--CK ", "event_count": true, "value": 50, "updated_online": true, "performance": false, "auto_keep": true, "prefailure": false}, "value": 49, "raw": {"string": "51", "value": 51}, "thresh": 0, "when_failed": "", "worst": 32, "id": 190}, {"name": "Hardware_ECC_Recovered", "flags": {"error_rate": true, "string": "-O-RC- ", "event_count": true, "value": 26, "updated_online": true, "performance": false, "auto_keep": false, "prefailure": false}, "value": 200, "raw": {"string": "0", "value": 0}, "thresh": 0, "when_failed": "", "worst": 200, "id": 195}, {"name": "UDMA_CRC_Error_Count", "flags": {"error_rate": true, "string": "-OSRCK ", "event_count": true, "value": 62, "updated_online": true, "performance": true, "auto_keep": true, "prefailure": false}, "value": 100, "raw": {"string": "0", "value": 0}, "thresh": 0, "when_failed": "", "worst": 100, "id": 199}, {"name": "Unknown_Attribute", "flags": {"error_rate": false, "string": "-O--C- ", "event_count": true, "value": 18, "updated_online": true, "performance": false, "auto_keep": false, "prefailure": false}, "value": 99, "raw": {"string": "60", "value": 60}, "thresh": 0, "when_failed": "", "worst": 99, "id": 235}, {"name": "Total_LBAs_Written", "flags": {"error_rate": false, "string": "-O--CK ", "event_count": true, "value": 50, "updated_online": true, "performance": false, "auto_keep": true, "prefailure": false}, "value": 99, "raw": {"string": "11997733492", "value": 11997733492}, "thresh": 0, "when_failed": "", "worst": 99, "id": 241}], "revision": 1}, "ata_sct_capabilities": {"data_table_supported": true, "error_recovery_control_supported": true, "value": 61, "feature_control_supported": true}, "json_format_version": [1, 0], "logical_block_size": 512, "sata_version": {"string": "SATA 3.3", "value": 511}, "serial_number": "S5RRNF0RB82155Z", "power_cycle_count": 87, "ata_smart_self_test_log": {"standard": {"count": 0, "revision": 1}}, "ata_smart_selective_self_test_log": {"table": [{"status": {"string": "Not_testing", "value": 0}, "lba_max": 0, "lba_min": 0}, {"status": {"string": "Not_testing", "value": 0}, "lba_max": 0, "lba_min": 0}, {"status": {"string": "Not_testing", "value": 0}, "lba_max": 0, "lba_min": 0}, {"status": {"string": "Not_testing", "value": 0}, "lba_max": 0, "lba_min": 0}, {"status": {"string": "Not_testing", "value": 0}, "lba_max": 0, "lba_min": 0}], "current_read_scan": {"status": {"string": "was never started", "value": 0}, "lba_max": 65535, "lba_min": 0}, "flags": {"remainder_scan_enabled": false, "value": 0}, "power_up_scan_resume_minutes": 0, "revision": 1}, "physical_block_size": 512, "device": {"protocol": "ATA", "type": "sat", "name": "/dev/sda", "info_name": "/dev/sda [SAT]"}, "in_smartctl_database": false, "ata_smart_data": {"self_test": {"status": {"passed": true, "string": "completed without error", "value": 0}, "polling_minutes": {"short": 2, "extended": 85}}, "offline_data_collection": {"status": {"string": "was never started", "value": 0}, "completion_seconds": 0}, "capabilities": {"offline_surface_scan_supported": false, "attribute_autosave_enabled": true, "gp_logging_supported": true, "offline_is_aborted_upon_new_cmd": false, "error_logging_supported": true, "exec_offline_immediate_supported": true, "conveyance_self_test_supported": false, "self_tests_supported": true, "selective_self_test_supported": true, "values": [83, 3]}}, "local_time": {"time_t": 1720084783, "asctime": "Thu Jul  4 10:19:43 2024 WEST"}, "ata_smart_error_log": {"summary": {"count": 0, "revision": 1}}, "model_name": "Samsung SSD 870 QVO 1TB"}}
[10:19 vp6670 ~]# xe host-call-plugin host-uuid=bf2761ed-a851-4034-9cee-2b698509d46a  plugin=smartctl.py fn=health
{"/dev/nvme0": "PASSED", "/dev/sda": "PASSED"}
Lot of data. Uff.
Can we parse that for the values I'm interested in?
Trying to get the info I got in proxmox:
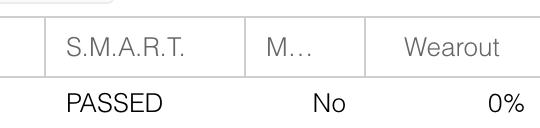
The Passed I get with your 2nd command.Appreciate your help!
-
@manilx Used https://jsonformatter.org/json-parser to parse the output:
Having this values, what is the wear? 2% ("value": 98) ?"name": "Wear_Leveling_Count", "flags": { "error_rate": false, "string": "PO--C- ", "event_count": true, "value": 19, "updated_online": true, "performance": false, "auto_keep": false, "prefailure": true }, "value": 98, "raw": { "string": "11", "value": 11 }, -
@manilx Got this from ChatGPT, so I think I got this.
Would be great to just get these values from a cli command but I'm not up to the taskThe output from smartctl you provided contains information about the Wear Leveling Count attribute of an SSD. This attribute is used to indicate the wear and tear of the NAND flash memory cells in the SSD.
Let's break down the relevant parts of the output:
"Wear_Leveling_Count": This is the attribute being measured.
"value": 98: This is the normalized value of the Wear Leveling Count. Normalized values typically start at 100 for new drives and decrease as the drive ages and wears out.
"raw": { "string": "11", "value": 11 }: The raw value is the actual measurement from the SSD's controller. In this case, it is 11.Interpretation
Normalized Value (98): This indicates the relative health of the SSD. A value of 98 means the SSD is still in good health, as it is close to the initial value of 100.
Raw Value (11): This typically represents the number of cycles or the wear level. In this case, it likely indicates the number of times the cells have been erased and written.Wear Level
SSDs generally have a threshold for when they are considered worn out, often around a normalized value of 10 or lower. With a normalized value of 98, your SSD is in very good health and shows minimal wear. The raw value of 11 suggests the SSD has gone through 11 cycles of wear leveling, which is quite low."
Hello! It looks like you're interested in this conversation, but you don't have an account yet.
Getting fed up of having to scroll through the same posts each visit? When you register for an account, you'll always come back to exactly where you were before, and choose to be notified of new replies (either via email, or push notification). You'll also be able to save bookmarks and upvote posts to show your appreciation to other community members.
With your input, this post could be even better 💗
Register Login