Apologies for the late response - life got in the way!
I tried your tweaks and these appear to have solved the issue. The VM has been stable for over a month, which also included a reboot or two to install updates. Thanks for the help.
Apologies for the late response - life got in the way!
I tried your tweaks and these appear to have solved the issue. The VM has been stable for over a month, which also included a reboot or two to install updates. Thanks for the help.
I have done some further testing on this (I have setup a test VM).
What I have learnt:
@dinhngtu well, would you believe it, but a reboot of the host seems to have solved the problem. I haven't done anything else and one of the Windows 10 test VMs that I was playing with quite merrily completed its setup process and loaded into Windows with no drama.
@dinhngtu I believe it was changing the guest TSC Mode that seems to have done the trick.
@dinhngtu I believe it was changing the guest TSC Mode that seems to have done the trick.
Apologies for the late response - life got in the way!
I tried your tweaks and these appear to have solved the issue. The VM has been stable for over a month, which also included a reboot or two to install updates. Thanks for the help.
@dinhngtu No, I haven't tried those. The host reboot appeared to fix the original issue and I had forgotten about them when I was troubleshooting the restart yesterday.
I'll do a bit more playing around with this in a few days and report back.
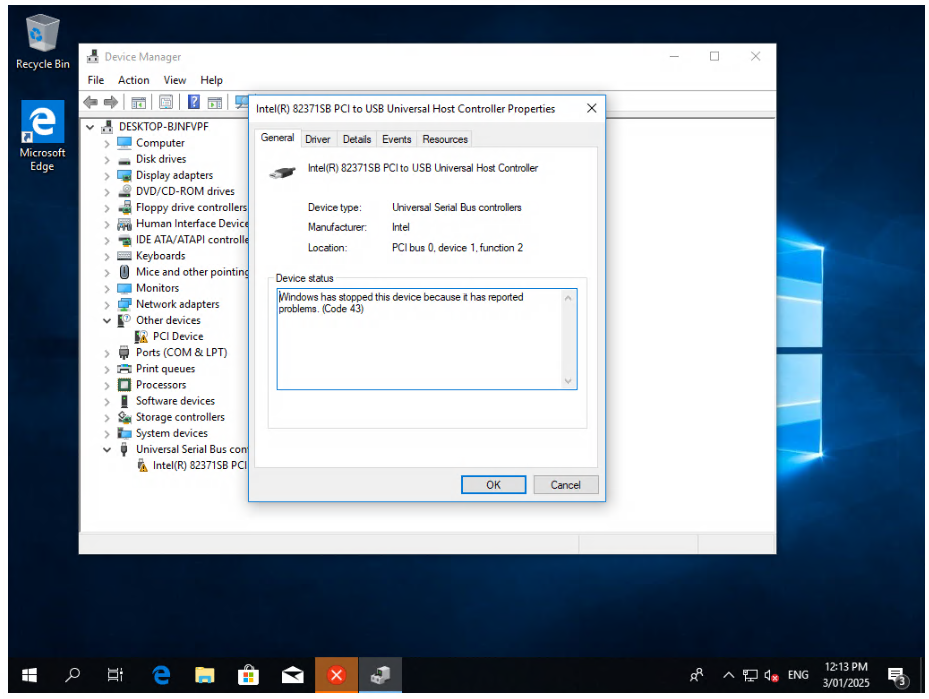
@dinhngtu yes, same issue, same BSOD error message at the same point (very early) in the boot process. System seems to be perfectly stable once booted.
I struggle to see how it’s a hardware issue when older versions of Windows have worked just fine, as has every single Linux VM I’ve installed. Also, if it was a hardware issue I’d expect the VM to be unstable, which it does not appear to be. Seems more likely that there is something happening during the very early stages of boot that Xen is not handling gracefully/reliably.
Well sadly that's not the end of the story. After running just fine for a week or two, including multiple reboots in the early stages of installing apps etc, the most recent reboot (to install some sort of 'touchscreen driver' update) has caused a reoccurrence of this issue.
After a few tries, and leaving the VM off for a few minutes, I managed to get it to boot up again, but there is clearly some sort of issue here.
@dinhngtu well, would you believe it, but a reboot of the host seems to have solved the problem. I haven't done anything else and one of the Windows 10 test VMs that I was playing with quite merrily completed its setup process and loaded into Windows with no drama.
@dinhngtu I can confirm that it was setup as a single CPU with dual cores. I have adjusted to be one CPU with 6 cores, and that doesn't help matters.
It's worth noting that I occasionally get it to boot off the install ISO and complete the installation, but booting into the installed OS subsequently fails. It appears there is something intermittent here that's causing it to fail most of the time, but occasionally make it through.
@dinhngtu I think it’s just a simple single processor with dual cores configuration, but I’ll check when I can.
Worth noting too that that crash dump was from a VM with Viridian disabled (not an intentional choice, was just disabled from some other playing around). I’ve tried to get a crash dump with it enabled, but the system just keeps hanging at about the point I expect it to crash, so I never get a crash dump.
@dinhngtu ok, after some more mucking about, I worked out what I was doing wrong. You need to have the "break on connect" flag set in Windbg for it to show when the system has stopped, and then be able to hit the go button to continue. Once I did that, my experience matched up with your instructions.
My next failing was continuing on until I saw the BSOD on the VM, at which point the debugger was unable to analyse the crash and create the dump file. Second time around I didn't make that mistake, so I now have a successful crash dump and analysis.
Here's the output of the command window during the debugging session:
************* Preparing the environment for Debugger Extensions Gallery repositories **************
   ExtensionRepository : Implicit
   UseExperimentalFeatureForNugetShare : true
   AllowNugetExeUpdate : true
   NonInteractiveNuget : true
   AllowNugetMSCredentialProviderInstall : true
   AllowParallelInitializationOfLocalRepositories : true
   EnableRedirectToChakraJsProvider : false

   -- Configuring repositories
      ----> Repository : LocalInstalled, Enabled: true
      ----> Repository : UserExtensions, Enabled: true

>>>>>>>>>>>>> Preparing the environment for Debugger Extensions Gallery repositories completed, duration 0.000 seconds

************* Waiting for Debugger Extensions Gallery to Initialize **************

>>>>>>>>>>>>> Waiting for Debugger Extensions Gallery to Initialize completed, duration 0.016 seconds
   ----> Repository : UserExtensions, Enabled: true, Packages count: 0
   ----> Repository : LocalInstalled, Enabled: true, Packages count: 45

Microsoft (R) Windows Debugger Version 10.0.27920.1001 AMD64
Copyright (c) Microsoft Corporation. All rights reserved.

Opened 192.168.205.10
Waiting to reconnect...
BD: Boot Debugger Initialized
Connected to Windows Boot Debugger 26100 x64 target at (Sun Oct 12 16:36:29.370 2025 (UTC + 13:00)), ptr64 TRUE
Kernel Debugger connection established.
Symbol search path is: srv*
Executable search path is:
ReadVirtual() failed in GetXStateConfiguration() first read attempt (error == 0.)
Windows Boot Debugger Kernel Version 26100 UP Free x64
Primary image base = 0x00000000`016d0000 Loaded module list = 0x00000000`019499e8
System Uptime: not available
bootmgr!DebugService2+0x5:
00000000`01923755 cc              int     3
kd> g
Shutdown occurred at (Sun Oct 12 16:36:49.449 2025 (UTC + 13:00))...unloading all symbol tables.
Waiting to reconnect...
BD: Boot Debugger Initialized
Connected to Windows Boot Debugger 19041 x64 target at (Sun Oct 12 16:36:50.780 2025 (UTC + 13:00)), ptr64 TRUE
Kernel Debugger connection established.

************* Path validation summary **************
Response                         Time (ms)     Location
Deferred                                       srv*
Symbol search path is: srv*
Executable search path is:
ReadVirtual() failed in GetXStateConfiguration() first read attempt (error == 0.)
Windows Boot Debugger Kernel Version 19041 UP Free x64
Primary image base = 0x00000000`01300000 Loaded module list = 0x00000000`014afa98
System Uptime: not available
winload!DebugService2+0x5:
00000000`0146ece5 cc              int     3
kd> g
Shutdown occurred at (Sun Oct 12 16:37:18.377 2025 (UTC + 13:00))...unloading all symbol tables.
Waiting to reconnect...
BD: Boot Debugger Initialized
Connected to Windows Boot Debugger 19041 x64 target at (Sun Oct 12 16:37:19.340 2025 (UTC + 13:00)), ptr64 TRUE
Kernel Debugger connection established.

************* Path validation summary **************
Response                         Time (ms)     Location
Deferred                                       srv*
Symbol search path is: srv*
Executable search path is:
Windows Boot Debugger Kernel Version 19041 UP Free x64
Primary image base = 0x00000000`01300000 Loaded module list = 0x00000000`014afa98
System Uptime: not available
winload!DebugService2+0x5:
00000000`0146ece5 cc              int     3
kd> g
Shutdown occurred at (Sun Oct 12 16:37:43.699 2025 (UTC + 13:00))...unloading all symbol tables.
Waiting to reconnect...
Connected to Windows 10 19041 x64 target at (Sun Oct 12 16:37:44.812 2025 (UTC + 13:00)), ptr64 TRUE
Kernel Debugger connection established.

************* Path validation summary **************
Response                         Time (ms)     Location
Deferred                                       srv*
Symbol search path is: srv*
Executable search path is:
Windows 10 Kernel Version 19041 MP (1 procs) Free x64
Edition build lab: 19041.3636.amd64fre.vb_release_svc_prod3.231019-1741
Kernel base = 0xfffff801`5a200000 PsLoadedModuleList = 0xfffff801`5ae2a930
System Uptime: 0 days 0:00:00.001
nt!DebugService2+0x5:
fffff801`5a606f85 cc              int     3
kd> g
KDTARGET: Refreshing KD connection

*** Fatal System Error: 0x0000007e
                       (0xFFFFFFFFC0000094,0xFFFFF8015A69706C,0xFFFF9E03AF6897C8,0xFFFF9E03AF689000)

Break instruction exception - code 80000003 (first chance)

A fatal system error has occurred.
Debugger entered on first try; Bugcheck callbacks have not been invoked.

A fatal system error has occurred.

For analysis of this file, run !analyze -v
nt!DbgBreakPointWithStatus:
fffff801`5a606f30 cc              int     3
0: kd> !analyze -v
Connected to Windows 10 19041 x64 target at (Sun Oct 12 16:50:59.853 2025 (UTC + 13:00)), ptr64 TRUE
Loading Kernel Symbols
....

Press ctrl-c (cdb, kd, ntsd) or ctrl-break (windbg) to abort symbol loads that take too long.
Run !sym noisy before .reload to track down problems loading symbols.

...........................................................
................................................................
..........
Loading User Symbols

*******************************************************************************
*                                                                             *
*                        Bugcheck Analysis                                    *
*                                                                             *
*******************************************************************************

SYSTEM_THREAD_EXCEPTION_NOT_HANDLED (7e)
This is a very common BugCheck.  Usually the exception address pinpoints
the driver/function that caused the problem.  Always note this address
as well as the link date of the driver/image that contains this address.
Arguments:
Arg1: ffffffffc0000094, The exception code that was not handled
Arg2: fffff8015a69706c, The address that the exception occurred at
Arg3: ffff9e03af6897c8, Exception Record Address
Arg4: ffff9e03af689000, Context Record Address

Debugging Details:
------------------


Press ctrl-c (cdb, kd, ntsd) or ctrl-break (windbg) to abort symbol loads that take too long.
Run !sym noisy before .reload to track down problems loading symbols.


KEY_VALUES_STRING: 1

    Key  : Analysis.CPU.mSec
    Value: 4625

    Key  : Analysis.Elapsed.mSec
    Value: 273277

    Key  : Analysis.IO.Other.Mb
    Value: 25

    Key  : Analysis.IO.Read.Mb
    Value: 1

    Key  : Analysis.IO.Write.Mb
    Value: 19

    Key  : Analysis.Init.CPU.mSec
    Value: 8406

    Key  : Analysis.Init.Elapsed.mSec
    Value: 1067795

    Key  : Analysis.Memory.CommitPeak.Mb
    Value: 93

    Key  : Analysis.Version.DbgEng
    Value: 10.0.27920.1001

    Key  : Analysis.Version.Description
    Value: 10.2506.23.01 amd64fre

    Key  : Analysis.Version.Ext
    Value: 1.2506.23.1

    Key  : Bugcheck.Code.KiBugCheckData
    Value: 0x7e

    Key  : Bugcheck.Code.LegacyAPI
    Value: 0x7e

    Key  : Bugcheck.Code.TargetModel
    Value: 0x7e

    Key  : Failure.Bucket
    Value: 0x7E_C0000094_nt!MiComputeRunTimeZeroComparisons

    Key  : Failure.Exception.Code
    Value: 0xc0000094

    Key  : Failure.Exception.IP.Address
    Value: 0xfffff8015a69706c

    Key  : Failure.Exception.IP.Module
    Value: nt

    Key  : Failure.Exception.IP.Offset
    Value: 0x49706c

    Key  : Failure.Exception.Record
    Value: 0xffff9e03af6897c8

    Key  : Failure.Hash
    Value: {08aa3e5b-968e-659a-d0a6-6a71f6ff3635}

    Key  : Hypervisor.Enlightenments.Value
    Value: 0

    Key  : Hypervisor.Enlightenments.ValueHex
    Value: 0x0

    Key  : Hypervisor.Flags.AnyHypervisorPresent
    Value: 1

    Key  : Hypervisor.Flags.ApicEnlightened
    Value: 0

    Key  : Hypervisor.Flags.ApicVirtualizationAvailable
    Value: 0

    Key  : Hypervisor.Flags.AsyncMemoryHint
    Value: 0

    Key  : Hypervisor.Flags.CoreSchedulerRequested
    Value: 0

    Key  : Hypervisor.Flags.CpuManager
    Value: 0

    Key  : Hypervisor.Flags.DeprecateAutoEoi
    Value: 0

    Key  : Hypervisor.Flags.DynamicCpuDisabled
    Value: 0

    Key  : Hypervisor.Flags.Epf
    Value: 0

    Key  : Hypervisor.Flags.ExtendedProcessorMasks
    Value: 0

    Key  : Hypervisor.Flags.HardwareMbecAvailable
    Value: 0

    Key  : Hypervisor.Flags.MaxBankNumber
    Value: 0

    Key  : Hypervisor.Flags.MemoryZeroingControl
    Value: 0

    Key  : Hypervisor.Flags.NoExtendedRangeFlush
    Value: 0

    Key  : Hypervisor.Flags.NoNonArchCoreSharing
    Value: 0

    Key  : Hypervisor.Flags.Phase0InitDone
    Value: 0

    Key  : Hypervisor.Flags.PowerSchedulerQos
    Value: 0

    Key  : Hypervisor.Flags.RootScheduler
    Value: 0

    Key  : Hypervisor.Flags.SynicAvailable
    Value: 0

    Key  : Hypervisor.Flags.UseQpcBias
    Value: 0

    Key  : Hypervisor.Flags.Value
    Value: 4096

    Key  : Hypervisor.Flags.ValueHex
    Value: 0x1000

    Key  : Hypervisor.Flags.VpAssistPage
    Value: 0

    Key  : Hypervisor.Flags.VsmAvailable
    Value: 0

    Key  : Hypervisor.RootFlags.AccessStats
    Value: 0

    Key  : Hypervisor.RootFlags.CrashdumpEnlightened
    Value: 0

    Key  : Hypervisor.RootFlags.CreateVirtualProcessor
    Value: 0

    Key  : Hypervisor.RootFlags.DisableHyperthreading
    Value: 0

    Key  : Hypervisor.RootFlags.HostTimelineSync
    Value: 0

    Key  : Hypervisor.RootFlags.HypervisorDebuggingEnabled
    Value: 0

    Key  : Hypervisor.RootFlags.IsHyperV
    Value: 0

    Key  : Hypervisor.RootFlags.LivedumpEnlightened
    Value: 0

    Key  : Hypervisor.RootFlags.MapDeviceInterrupt
    Value: 0

    Key  : Hypervisor.RootFlags.MceEnlightened
    Value: 0

    Key  : Hypervisor.RootFlags.Nested
    Value: 0

    Key  : Hypervisor.RootFlags.StartLogicalProcessor
    Value: 0

    Key  : Hypervisor.RootFlags.Value
    Value: 0

    Key  : Hypervisor.RootFlags.ValueHex
    Value: 0x0

    Key  : SecureKernel.HalpHvciEnabled
    Value: 0

    Key  : WER.OS.Branch
    Value: vb_release_svc_prod3

    Key  : WER.OS.Version
    Value: 10.0.19041.3636


BUGCHECK_CODE:  7e

BUGCHECK_P1: ffffffffc0000094

BUGCHECK_P2: fffff8015a69706c

BUGCHECK_P3: ffff9e03af6897c8

BUGCHECK_P4: ffff9e03af689000

FAULTING_THREAD:  ffff8a03761f1300

EXCEPTION_RECORD:  ffff9e03af6897c8 -- (.exr 0xffff9e03af6897c8)
ExceptionAddress: fffff8015a69706c (nt!MiComputeRunTimeZeroComparisons+0x00000000000ec1f4)
   ExceptionCode: c0000094 (Integer divide-by-zero)
  ExceptionFlags: 00000000
NumberParameters: 0

CONTEXT:  ffff9e03af689000 -- (.cxr 0xffff9e03af689000)
rax=0000000000000000 rbx=0000000000000000 rcx=0000000000000002
rdx=0000000000000000 rsi=0000000000000000 rdi=fffff60000008108
rip=fffff8015a69706c rsp=ffff9e03af689a00 rbp=0000000000000000
 r8=ffff8a03760e1078  r9=0000000000000000 r10=ffff8a03760e1070
r11=0000000000000000 r12=0000000000000000 r13=fffff8015ae50d80
r14=ffff8a03760e1070 r15=ffff8a0376051060
iopl=0         nv up ei pl nz na po nc
cs=0010  ss=0018  ds=002b  es=002b  fs=0053  gs=002b             efl=00010206
nt!MiComputeRunTimeZeroComparisons+0xec1f4:
fffff801`5a69706c 49f7f1          div     rax,r9
Resetting default scope

PROCESS_NAME:  System

ERROR_CODE: (NTSTATUS) 0xc0000094 - {EXCEPTION}  Integer division by zero.

EXCEPTION_CODE_STR:  c0000094

EXCEPTION_STR:  0xc0000094

STACK_TEXT:
ffff9e03`af689a00 fffff801`5a5aae03     : 00000000`00000000 ffff8a03`76096980 fffff600`00007000 fffff801`5ae50d80 : nt!MiComputeRunTimeZeroComparisons+0xec1f4
ffff9e03`af689a40 fffff801`5a5ab2ad     : 00000000`00000000 00000000`00000002 00000000`00000000 00000000`00000000 : nt!MiZeroPageCalibrate+0x1bf
ffff9e03`af689b00 fffff801`5a55d6e5     : ffff8a03`00000001 fffff801`00000001 ffffffff`80000050 ffff8a03`760b7410 : nt!MiZeroNodePages+0x26d
ffff9e03`af689c10 fffff801`5a606578     : fffff801`5802b180 ffff8a03`761f1300 fffff801`5a55d690 00000000`00000000 : nt!PspSystemThreadStartup+0x55
ffff9e03`af689c60 00000000`00000000     : ffff9e03`af68a000 ffff9e03`af684000 00000000`00000000 00000000`00000000 : nt!KiStartSystemThread+0x28


SYMBOL_NAME:  nt!MiComputeRunTimeZeroComparisons+ec1f4

MODULE_NAME: nt

IMAGE_VERSION:  10.0.19041.6328

STACK_COMMAND: .cxr 0xffff9e03af689000 ; kb

IMAGE_NAME:  ntkrnlmp.exe

BUCKET_ID_FUNC_OFFSET:  ec1f4

FAILURE_BUCKET_ID:  0x7E_C0000094_nt!MiComputeRunTimeZeroComparisons

OS_VERSION:  10.0.19041.3636

BUILDLAB_STR:  vb_release_svc_prod3

OSPLATFORM_TYPE:  x64

OSNAME:  Windows 10

FAILURE_ID_HASH:  {08aa3e5b-968e-659a-d0a6-6a71f6ff3635}

Followup:     MachineOwner
---------

0: kd> .dump /o C:\Win10BootCrask.dmp
******************************************************************************
INFORMATIONAL: Dump file will not contain user mode memory or user mode module list
Press Ctrl-C or Ctrl-Break if you want to terminate the command.
******************************************************************************
Unable to create file 'C:\Win10BootCrask.dmp' - Win32 error 0n5
    "Access is denied."
0: kd> .dump /o C:\Users\Michael Williams\Desktop\Win10B00tCrash.dmp
******************************************************************************
INFORMATIONAL: Dump file will not contain user mode memory or user mode module list
Press Ctrl-C or Ctrl-Break if you want to terminate the command.
******************************************************************************
Creating C:\Users\Michael Williams\Desktop\Win10B00tCrash.dmp - mini kernel dump


Press ctrl-c (cdb, kd, ntsd) or ctrl-break (windbg) to abort symbol loads that take too long.
Run !sym noisy before .reload to track down problems loading symbols.

KdDebuggerData.MmMaximumNonPagedPoolInBytes is NULL
KdDebuggerData.MmAllocatedNonPagedPool is NULL
KdDebuggerData.MmTotalCommittedPages is NULL
KdDebuggerData.MmPeakCommitment is NULL
KdDebuggerData.MmTotalCommitLimitMaximum is NULL
Dump successfully written
Here's a link to download the crash dump: https://drive.google.com/file/d/1MHnhivvGKYilsG2_FI5S-_VXHWZe_8AY/view?usp=sharing
Hopefully I've managed to collect everything you need.
@dinhngtu thanks for that info and for the PM.
I managed to successfully update the bcd, however after rebuilding the ISO, I cannot get the VM to boot from it, I just end up in the EFI shell. I was following these instructions: https://www.wintips.org/how-to-edit-iso-file-modify-windows-iso-bootable-image/ The only deviation I had to make was to manually set the file system to UDF, since the prompt shown in the instructions did not come up.
I used the WinPE ISO that you provided, which did boot, however I didn't have a lot of joy getting any much information out of it. I managed to get WinDbg to connect and show the status, however the VM ultimately just hung on the following screen:
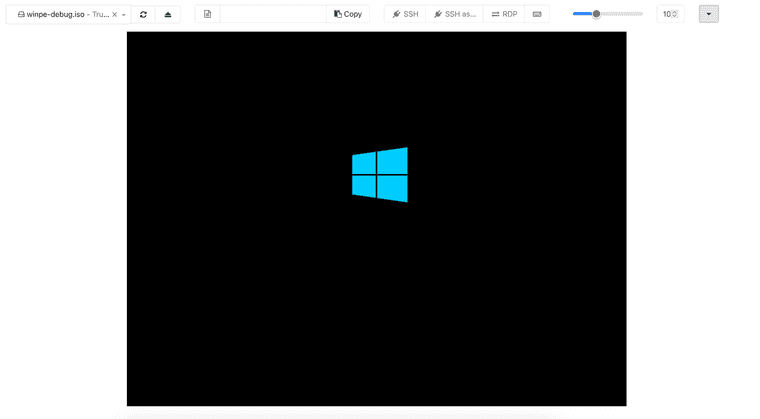
Note that either WinDbg was either showing that the Debugee was busy/running or disconnected. It wasn't waiting for me to click go at any point.
This is what was shown in the WinDbg command window:
************* Preparing the environment for Debugger Extensions Gallery repositories **************
   ExtensionRepository : Implicit
   UseExperimentalFeatureForNugetShare : true
   AllowNugetExeUpdate : true
   NonInteractiveNuget : true
   AllowNugetMSCredentialProviderInstall : true
   AllowParallelInitializationOfLocalRepositories : true
   EnableRedirectToChakraJsProvider : false

   -- Configuring repositories
      ----> Repository : LocalInstalled, Enabled: true
      ----> Repository : UserExtensions, Enabled: true

>>>>>>>>>>>>> Preparing the environment for Debugger Extensions Gallery repositories completed, duration 0.000 seconds

************* Waiting for Debugger Extensions Gallery to Initialize **************

>>>>>>>>>>>>> Waiting for Debugger Extensions Gallery to Initialize completed, duration 0.062 seconds
   ----> Repository : UserExtensions, Enabled: true, Packages count: 0
   ----> Repository : LocalInstalled, Enabled: true, Packages count: 45

Microsoft (R) Windows Debugger Version 10.0.27920.1001 AMD64
Copyright (c) Microsoft Corporation. All rights reserved.

Opened 192.168.205.10
Waiting to reconnect...
BD: Boot Debugger Initialized
Connected to Windows Boot Debugger 26100 x64 target at (Sun Oct 12 12:39:23.766 2025 (UTC + 13:00)), ptr64 TRUE
Kernel Debugger connection established.
Symbol search path is: srv*
Executable search path is:
ReadVirtual() failed in GetXStateConfiguration() first read attempt (error == 0.)
Windows Boot Debugger Kernel Version 26100 UP Free x64
Primary image base = 0x00000000`016d0000 Loaded module list = 0x00000000`019499e8
System Uptime: not available
Shutdown occurred at (Sun Oct 12 12:41:48.383 2025 (UTC + 13:00))...unloading all symbol tables.
Waiting to reconnect...
BD: Boot Debugger Initialized
Connected to Windows Boot Debugger 19041 x64 target at (Sun Oct 12 12:41:49.330 2025 (UTC + 13:00)), ptr64 TRUE
Kernel Debugger connection established.

************* Path validation summary **************
Response                         Time (ms)     Location
Deferred                                       srv*
Symbol search path is: srv*
Executable search path is:
ReadVirtual() failed in GetXStateConfiguration() first read attempt (error == 0.)
Windows Boot Debugger Kernel Version 19041 UP Free x64
Primary image base = 0x00000000`01300000 Loaded module list = 0x00000000`014afa98
System Uptime: not available
Shutdown occurred at (Sun Oct 12 12:42:15.478 2025 (UTC + 13:00))...unloading all symbol tables.
Waiting to reconnect...
BD: Boot Debugger Initialized
Connected to Windows Boot Debugger 19041 x64 target at (Sun Oct 12 12:42:16.760 2025 (UTC + 13:00)), ptr64 TRUE
Kernel Debugger connection established.

************* Path validation summary **************
Response                         Time (ms)     Location
Deferred                                       srv*
Symbol search path is: srv*
Executable search path is:
Windows Boot Debugger Kernel Version 19041 UP Free x64
Primary image base = 0x00000000`01300000 Loaded module list = 0x00000000`014afa98
System Uptime: not available
Shutdown occurred at (Sun Oct 12 12:42:22.714 2025 (UTC + 13:00))...unloading all symbol tables.
Waiting to reconnect...
Connected to Windows 10 19041 x64 target at (Sun Oct 12 12:42:24.039 2025 (UTC + 13:00)), ptr64 TRUE
Kernel Debugger connection established.

************* Path validation summary **************
Response                         Time (ms)     Location
Deferred                                       srv*
Symbol search path is: srv*
Executable search path is:
Windows 10 Kernel Version 19041 MP (1 procs) Free x64
Edition build lab: 19041.3636.amd64fre.vb_release_svc_prod3.231019-1741
Kernel base = 0xfffff803`51e00000 PsLoadedModuleList = 0xfffff803`52a2a930
System Uptime: not available
... Retry sending the same data packet for 64 times.
The transport connection between host kernel debugger and target Windows seems lost.
please try resync with target, recycle the host debugger, or reboot the target Windows.
... Retry sending the same data packet for 128 times.
... Retry sending the same data packet for 192 times.