XCP-NG vm's extremly slow
-
@olivierlambert definitely doesn't ring any bells but definitely smells like a storage issue, I would test disk performance directly in dom0 on the RAID SR using something like FIO, although we don't provide this in our repos so that would be difficult to get in dom0. perhaps a simple dd speed test under the SR mount directly, you should be able to find it by running
df -h. Just be sure you don't overwrite any VM disk files")
-
i would agree that it sounds like an storage problem, but it's unlikley that this happends on 2 brand new machines at the same time and the dom0 should be affected with the same problems when it's a hardware case.
What does this "vif vif-5-1 vif5.1: Guest Rx stalled" mean? Rx stand for some information recieve?
-
@Andi79 it's impossible to say without more testing, it could be a firmware issue on these boards causing IO stalls or similar, the only way to be sure now is to run some perf tests inside dom0 to confirm it's not VM related, once you get that confirmation, install (or live boot) plain CentOS on one of the machine and test there as well. Are both the SSD and the HDD underneath an mdadm software raid? I suppose it could be a software raid configuration issue as well, but it's hard to say without further testing
-
@Andi79 the guest RX messages are normal, some OSs like debian etc put unused interfaces in some type of "sleep" mode if I remember correctly and this causes these harmless messages
-
I am no expert here but I had vm crashing on me before when transfering data and it was because the VM started its life with a very large amount of RAM. Then it was reduce and the setting in Memory limits (min/max) was messed up.
What do you have for Memory limits (min/max) and what is the current VM memory? -
on machine 1 the SSDs (sda/sdb) are a raid 1, the 4tb hdd is no raid
on machine 2 there is sda/sdb the 960GB SSD raid 1, sdc/sdd a 4TB raid 1all raids are software raids. On Machine 1 all configuration was done by xcp-ng during installation, on machine 2 it didn't work to create 2 raids by installer, so i configured it manually during installation
server 1:
 mdadm --detail /dev/md127
/dev/md127:
           Version : 1.0
     Creation Time : Fri May 13 00:42:01 2022
        Raid Level : raid1
        Array Size : 937692352 (894.25 GiB 960.20 GB)
     Used Dev Size : 937692352 (894.25 GiB 960.20 GB)
      Raid Devices : 2
     Total Devices : 2
       Persistence : Superblock is persistent

     Intent Bitmap : Internal

       Update Time : Thu Jun 16 10:54:29 2022
             State : active
    Active Devices : 2
   Working Devices : 2
    Failed Devices : 0
     Spare Devices : 0

Consistency Policy : bitmap

              Name : localhost:127
              UUID : 3291ed43:84e67acd:d548e8e9:3de5fa57
            Events : 3738

    Number   Major   Minor   RaidDevice State
       0       8        0        0      active sync   /dev/sda
       1       8       16        1      active sync   /dev/sdb
pvs Device read short 82432 bytes remaining Device read short 82432 bytes remaining Device read short 40960 bytes remaining WARNING: Not using device /dev/sda3 for PV hmMtFH-xKzv-cAXc-6Ezc-WKhT-TAna-ctQUxC. WARNING: PV hmMtFH-xKzv-cAXc-6Ezc-WKhT-TAna-ctQUxC prefers device /dev/md127p3 because device is used by LV. PV VG Fmt Attr PSize PFree /dev/md127p3 VG_XenStorage-745f4736-e407-1a8d-35f2-aa08309722d3 lvm2 a-- <852,74g 418,89g /dev/sdc VG_XenStorage-51542fdd-2993-3d0f-9edb-1a3fa03227b6 lvm2 a-- <3,64t <1,41tServer 2:
mdadm --detail /dev/md127
/dev/md127:
           Version : 1.0
     Creation Time : Sat Jun  4 09:56:54 2022
        Raid Level : raid1
        Array Size : 937692352 (894.25 GiB 960.20 GB)
     Used Dev Size : 937692352 (894.25 GiB 960.20 GB)
      Raid Devices : 2
     Total Devices : 2
       Persistence : Superblock is persistent

     Intent Bitmap : Internal

       Update Time : Thu Jun 16 11:00:07 2022
             State : clean
    Active Devices : 2
   Working Devices : 2
    Failed Devices : 0
     Spare Devices : 0

Consistency Policy : bitmap

              Name : localhost:127
              UUID : b5ab10b2:b89109af:9f4a274a:d7af50b3
            Events : 4450

    Number   Major   Minor   RaidDevice State
       0       8       32        0      active sync   /dev/sdc
       1       8       48        1      active sync   /dev/sdd
mdadm --detail /dev/md126 /dev/md126: Version : 1.2 Creation Time : Sat Jun 4 12:08:56 2022 Raid Level : raid1 Array Size : 3906886464 (3725.90 GiB 4000.65 GB) Used Dev Size : 3906886464 (3725.90 GiB 4000.65 GB) Raid Devices : 2 Total Devices : 2 Persistence : Superblock is persistent Intent Bitmap : Internal Update Time : Thu Jun 16 10:58:21 2022 State : active Active Devices : 2 Working Devices : 2 Failed Devices : 0 Spare Devices : 0 Consistency Policy : bitmap Name : klartext2-neu:md126 (local to host klartext2-neu) UUID : 784c25d6:18f3a0c2:ca8fe399:d16ec0e2 Events : 35384 Number Major Minor RaidDevice State 0 8 0 0 active sync /dev/sda 1 8 16 1 active sync /dev/sdb -
some tests:
Server 1 / dom0:
#dd if=/dev/zero of=/root/test bs=512 count=10000
10000+0 Datensätze ein
10000+0 Datensätze aus
5120000 Bytes (5,1 MB) kopiert, 0,0339501 s, 151 MB/s
Server 1 / VM 1:
#dd if=/dev/zero of=/root/test bs=512 count=10000
10000+0 records in
10000+0 records out
5120000 bytes (5,1 MB, 4,9 MiB) copied, 5,41172 s, 946 kB/s
it really seems to be VM related, but I don't see any reason why
-
I tested it one VM2 that's on the ssd
dd if=/dev/zero of=/root/test bs=512 count=10000
10000+0 records in
10000+0 records out
5120000 bytes (5,1 MB, 4,9 MiB) copied, 0,0153181 s, 334 MB/s
and on VM3, also hdd
dd if=/dev/zero of=/root/test bs=512 count=10000
10000+0 records in
10000+0 records out
5120000 bytes (5,1 MB) copied, 0,00494598 s, 1,0 GB/s
and on VM4, hdd
#dd if=/dev/zero of=/root/test bs=512 count=10000
10000+0 records in
10000+0 records out
5120000 bytes (5,1 MB, 4,9 MiB) copied, 82,3517 s, 62,2 kB/s (stopped)
the difference is that the first VM and the last VM have running backups with rsync... VM2 and VM3 are on very low load at the moment.
it occurs when there is runing anything on the machines
-
@fred974 they have 6 - 10GB Ram, but it's not memory related. It's some kind of strange IO Problem that blocks the whole VM that must be some combination of things. The VMs worked without any problems on other hosts, but the Host itself doesn't have any problems (and because there are 2 of them hardware problems are very unlikley).
-
perhaps this helps.
dom0
mpstat -P ALL
Linux 4.19.0+1 (klartext1) 	16.06.2022 	_x86_64_	(12 CPU)

12:00:43     CPU    %usr   %nice    %sys %iowait    %irq   %soft  %steal  %guest  %gnice   %idle
12:00:43     all    0,58    0,00    0,89    0,03    0,00    0,37    0,39    0,00    0,00   97,74
12:00:43       0    0,57    0,00    1,14    0,02    0,00    1,50    0,38    0,00    0,00   96,39
12:00:43       1    0,58    0,00    0,85    0,06    0,00    0,07    0,40    0,00    0,00   98,04
12:00:43       2    0,57    0,00    0,85    0,04    0,00    0,11    0,39    0,00    0,00   98,03
12:00:43       3    0,57    0,00    0,85    0,02    0,00    0,26    0,39    0,00    0,00   97,91
12:00:43       4    0,55    0,00    0,86    0,02    0,00    0,49    0,38    0,00    0,00   97,69
12:00:43       5    0,61    0,00    0,88    0,03    0,00    0,17    0,39    0,00    0,00   97,91
12:00:43       6    0,60    0,00    0,94    0,03    0,00    0,92    0,40    0,00    0,00   97,11
12:00:43       7    0,56    0,00    0,84    0,02    0,00    0,05    0,40    0,00    0,00   98,13
12:00:43       8    0,56    0,00    0,84    0,02    0,00    0,29    0,40    0,00    0,00   97,89
12:00:43       9    0,57    0,00    0,84    0,02    0,00    0,15    0,40    0,00    0,00   98,03
12:00:43      10    0,56    0,00    0,85    0,02    0,00    0,33    0,40    0,00    0,00   97,83
12:00:43      11    0,63    0,00    0,91    0,02    0,00    0,09    0,40    0,00    0,00   97,94
vm1:
mpstat -P ALL
Linux 5.15.0-37-generic (backup1) 	16.06.2022 	_x86_64_	(12 CPU)

10:02:33     CPU    %usr   %nice    %sys %iowait    %irq   %soft  %steal  %guest  %gnice   %idle
10:02:33     all    0,16    0,01    0,06   28,98    0,00    0,03    0,05    0,00    0,00   70,72
10:02:33       0    0,08    0,01    0,02   12,98    0,00    0,00    0,01    0,00    0,00   86,89
10:02:33       1    0,30    0,02    0,09   42,83    0,00    0,00    0,02    0,00    0,00   56,74
10:02:33       2    0,18    0,01    0,07   32,57    0,00    0,00    0,02    0,00    0,00   67,15
10:02:33       3    0,20    0,01    0,09   47,56    0,00    0,04    0,08    0,00    0,00   52,01
10:02:33       4    0,16    0,01    0,05   28,91    0,00    0,00    0,01    0,00    0,00   70,85
10:02:33       5    0,14    0,01    0,04   20,90    0,00    0,00    0,01    0,00    0,00   78,90
10:02:33       6    0,16    0,02    0,04   22,59    0,00    0,00    0,03    0,00    0,00   77,17
10:02:33       7    0,08    0,01    0,03   17,02    0,00    0,00    0,01    0,00    0,00   82,85
10:02:33       8    0,08    0,00    0,03   17,85    0,00    0,00    0,01    0,00    0,00   82,02
10:02:33       9    0,09    0,01    0,04   18,09    0,00    0,00    0,03    0,00    0,00   81,74
10:02:33      10    0,31    0,01    0,13   47,49    0,00    0,26    0,37    0,00    0,00   51,43
10:02:33      11    0,12    0,01    0,05   39,03    0,00    0,00    0,02    0,00    0,00   60,76
very high io wait.... but low usr that should be higher because of running rsyncs on user level
-
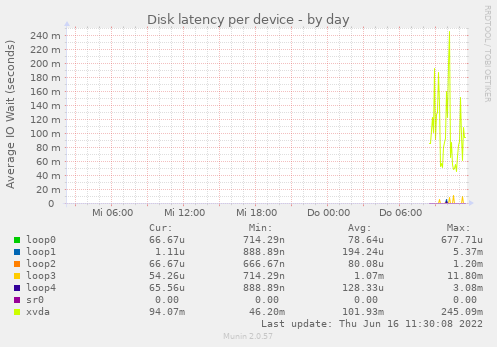
reported by munin on the slow VM. xvda has a latency ok 100ms. The problem occurs when there are many small file request like rsync does... and 100ms in sum is a lot. Any idea how I could debug the reason for this?
-
To me the issue is with a physical disk in your host, that's used then for your VM.
Having much latency on the
smartctlcommand isn't a good sign. -
actually it looks like that the 4TB on Server 1 really has hardware problems.... and the reason why there was the same effect on the other dom is that there was an mounted NFS Share of an machine on the first server..... and the disk errors on this machine where "transfered" to the other dom with the same affects (delaying the whole system).
I'm currently migrating all VMs von server1 to server2. I really hope that is the
solution for all. Currently rsync is not running on any machine... i will test this later when the VMs are transfered. -
That's very likely the issue yes
-
just wanted to tell the possible end of the story.... if anyone here ever has an simelar problem :-).
Currently it looks like that the Fan caused vibrations on the case that where transmitted to the hdd nearby.... the hdd is an SMR harddisk that seems to have problems with such vibrations.... that caused the problems on server1.
server2 had an nfs connection to a vds on server1. When IO was going to 100% because of the hdd error on server1 it caused exactly the same behavior on server2 (no idea why) even when there are no physical disk problems on this device.
Overall no XCP-NG problem, but such strange that it's hard to imagine what could cause this at the beginning :).
-
@Andi79 interesting results. It is known that vibrations can affect performance, but this is the worst I've heard of!
On that note I'd like to mention that SMR drives aren't very performant. As soon as write buffer fills and/or garbage collection kicks in, the performance goes down to a crawl.
-
Hahaha wow. Thanks a lot for the feedback, this is really interesting to know!
-
-
@fohdeesha lol :-). ok.... good to now :). Next optimization by decoupling harddisks and fans.... and always be quite on the datacenter :).
Hello! It looks like you're interested in this conversation, but you don't have an account yet.
Getting fed up of having to scroll through the same posts each visit? When you register for an account, you'll always come back to exactly where you were before, and choose to be notified of new replies (either via email, or push notification). You'll also be able to save bookmarks and upvote posts to show your appreciation to other community members.
With your input, this post could be even better 💗
Register Login