XCP-NG vm's extremly slow
-
now i noticed that tje jdb2 and kworker processes have gone... but system is still extremly slow
on this video i try to install munin for future data to analyse the problem. As you can see absolutly nothing happens (this can take many minutes now). There is a rsync "running" at a very slow speed, but as you can see cpu usage is ultra low and also top says no system load.
I think it must be a problem with xcp-ng, but I have no idea what it could be.
-
Can you do a
dmesgand also asmartctl -a /dev/sdbandsmartctl /dev/sda? -
output of dmsg (on the vm):
[132514.270681] systemd[1]: Starting Journal Service...
[132604.475796] systemd[1]: systemd-journald.service: start operation timed out. Terminating.
[132694.707996] systemd[1]: systemd-journald.service: State 'stop-sigterm' timed out. Killing.
[132694.708039] systemd[1]: systemd-journald.service: Killing process 60936 (systemd-journal) with signal SIGKILL.
[132784.940258] systemd[1]: systemd-journald.service: Processes still around after SIGKILL. Ignoring.
[132797.289939] systemd[1]: systemd-journald.service: Main process exited, code=killed, status=9/KILL
[132797.289947] systemd[1]: systemd-journald.service: Failed with result 'timeout'.
[132797.290322] systemd[1]: Failed to start Journal Service.
[132797.291608] systemd[1]: systemd-journald.service: Scheduled restart job, restart counter is at 18.
[132797.291833] systemd[1]: Stopped Journal Service.
[132797.324750] systemd[1]: Starting Journal Service...
[132808.130140] systemd-journald[61002]: File /var/log/journal/eb029b8cf0534f998db52d5afecd252b/system.journal corrupted or uncleanly shut down, renaming and replacing.
[132817.090264] systemd[1]: Started Journal Service.
[158702.774840] VFS: busy inodes on changed media sr0
i haven't installed smarttools on the VMs, but i can do.... from the video to now the apt for installing munin is on 4% now. it tooks very very long
-
Not in the VM, in the Dom0 please
")
-
@olivierlambert sorry :). that seems to be interesting.
[775961.059191] vif vif-5-1 vif5.1: Guest Rx stalled
[775971.060899] vif vif-5-1 vif5.1: Guest Rx ready
[775978.737860] vif vif-5-1 vif5.1: Guest Rx stalled
[775981.172611] vif vif-1-1 vif1.1: Guest Rx stalled
[775981.172612] vif vif-13-1 vif13.1: Guest Rx stalled
[775988.745427] vif vif-5-1 vif5.1: Guest Rx ready
[775988.803015] vif vif-5-1 vif5.1: Guest Rx stalled
[775991.305032] vif vif-13-1 vif13.1: Guest Rx ready
[775991.308940] vif vif-1-1 vif1.1: Guest Rx ready
[775992.359938] vif vif-13-1 vif13.1: Guest Rx stalled
[775997.663683] vif vif-10-1 vif10.1: Guest Rx stalled
[775998.983413] vif vif-5-1 vif5.1: Guest Rx ready
[775998.983418] vif vif-5-1 vif5.1: Guest Rx stalled
[776002.566713] vif vif-13-1 vif13.1: Guest Rx ready
[776002.713980] vif vif-13-1 vif13.1: Guest Rx stalled
[776007.653843] vif vif-10-1 vif10.1: Guest Rx ready
[776010.001242] vif vif-5-1 vif5.1: Guest Rx ready
[776012.516412] vif vif-5-1 vif5.1: Guest Rx stalled
[776012.804789] vif vif-13-1 vif13.1: Guest Rx ready
[776020.986445] vif vif-1-1 vif1.1: Guest Rx stalled
[776020.986456] vif vif-13-1 vif13.1: Guest Rx stalled
[776022.534917] vif vif-5-1 vif5.1: Guest Rx ready
smartctl -a /dev/sda smartctl 6.5 2016-05-07 r4318 [x86_64-linux-4.19.0+1] (local build) Copyright (C) 2002-16, Bruce Allen, Christian Franke, www.smartmontools.org === START OF INFORMATION SECTION === Device Model: INTEL SSDSC2KG960G8 Serial Number: BTYG201203PZ960CGN LU WWN Device Id: 5 5cd2e4 154e9cb05 Firmware Version: XCV10132 User Capacity: 960.197.124.096 bytes [960 GB] Sector Sizes: 512 bytes logical, 4096 bytes physical Rotation Rate: Solid State Device Form Factor: 2.5 inches Device is: Not in smartctl database [for details use: -P showall] ATA Version is: ACS-3 T13/2161-D revision 5 SATA Version is: SATA 3.2, 6.0 Gb/s (current: 6.0 Gb/s) Local Time is: Thu Jun 16 09:47:04 2022 CEST SMART support is: Available - device has SMART capability. SMART support is: Enabled === START OF READ SMART DATA SECTION === SMART overall-health self-assessment test result: PASSED General SMART Values: Offline data collection status: (0x00) Offline data collection activity was never started. Auto Offline Data Collection: Disabled. Self-test execution status: ( 0) The previous self-test routine completed without error or no self-test has ever been run. Total time to complete Offline data collection: ( 0) seconds. Offline data collection capabilities: (0x79) SMART execute Offline immediate. No Auto Offline data collection support. Suspend Offline collection upon new command. Offline surface scan supported. Self-test supported. Conveyance Self-test supported. Selective Self-test supported. SMART capabilities: (0x0003) Saves SMART data before entering power-saving mode. Supports SMART auto save timer. Error logging capability: (0x01) Error logging supported. General Purpose Logging supported. Short self-test routine recommended polling time: ( 1) minutes. Extended self-test routine recommended polling time: ( 2) minutes. Conveyance self-test routine recommended polling time: ( 2) minutes. SCT capabilities: (0x003d) SCT Status supported. SCT Error Recovery Control supported. SCT Feature Control supported. SCT Data Table supported. SMART Attributes Data Structure revision number: 1 Vendor Specific SMART Attributes with Thresholds: ID# ATTRIBUTE_NAME FLAG VALUE WORST THRESH TYPE UPDATED WHEN_FAILED RAW_VALUE 5 Reallocated_Sector_Ct 0x0032 100 100 000 Old_age Always - 0 9 Power_On_Hours 0x0032 100 100 000 Old_age Always - 607 12 Power_Cycle_Count 0x0032 100 100 000 Old_age Always - 15 170 Unknown_Attribute 0x0033 100 100 010 Pre-fail Always - 0 171 Unknown_Attribute 0x0032 100 100 000 Old_age Always - 0 172 Unknown_Attribute 0x0032 100 100 000 Old_age Always - 0 174 Unknown_Attribute 0x0032 100 100 000 Old_age Always - 8 175 Program_Fail_Count_Chip 0x0033 100 100 010 Pre-fail Always - 66811922817 183 Runtime_Bad_Block 0x0032 100 100 000 Old_age Always - 0 184 End-to-End_Error 0x0033 100 100 090 Pre-fail Always - 0 187 Reported_Uncorrect 0x0032 100 100 000 Old_age Always - 0 190 Airflow_Temperature_Cel 0x0022 065 061 000 Old_age Always - 35 (Min/Max 26/40) 192 Power-Off_Retract_Count 0x0032 100 100 000 Old_age Always - 8 194 Temperature_Celsius 0x0022 100 100 000 Old_age Always - 35 197 Current_Pending_Sector 0x0012 100 100 000 Old_age Always - 0 199 UDMA_CRC_Error_Count 0x003e 100 100 000 Old_age Always - 0 225 Unknown_SSD_Attribute 0x0032 100 100 000 Old_age Always - 29336 226 Unknown_SSD_Attribute 0x0032 100 100 000 Old_age Always - 20 227 Unknown_SSD_Attribute 0x0032 100 100 000 Old_age Always - 81 228 Power-off_Retract_Count 0x0032 100 100 000 Old_age Always - 36300 232 Available_Reservd_Space 0x0033 100 100 010 Pre-fail Always - 0 233 Media_Wearout_Indicator 0x0032 100 100 000 Old_age Always - 0 234 Unknown_Attribute 0x0032 100 100 000 Old_age Always - 0 235 Unknown_Attribute 0x0033 100 100 010 Pre-fail Always - 66811922817 241 Total_LBAs_Written 0x0032 100 100 000 Old_age Always - 29336 242 Total_LBAs_Read 0x0032 100 100 000 Old_age Always - 132918 243 Unknown_Attribute 0x0032 100 100 000 Old_age Always - 90104 SMART Error Log Version: 1 No Errors Logged SMART Self-test log structure revision number 1 No self-tests have been logged. [To run self-tests, use: smartctl -t] SMART Selective self-test log data structure revision number 1 SPAN MIN_LBA MAX_LBA CURRENT_TEST_STATUS 1 0 0 Not_testing 2 0 0 Not_testing 3 0 0 Not_testing 4 0 0 Not_testing 5 0 0 Not_testing Selective self-test flags (0x0): After scanning selected spans, do NOT read-scan remainder of disk. If Selective self-test is pending on power-up, resume after 0 minute delay.# smartctl -a /dev/sdb smartctl 6.5 2016-05-07 r4318 [x86_64-linux-4.19.0+1] (local build) Copyright (C) 2002-16, Bruce Allen, Christian Franke, www.smartmontools.org === START OF INFORMATION SECTION === Device Model: INTEL SSDSC2KG960G8 Serial Number: BTYG201306VP960CGN LU WWN Device Id: 5 5cd2e4 154eade4f Firmware Version: XCV10132 User Capacity: 960.197.124.096 bytes [960 GB] Sector Sizes: 512 bytes logical, 4096 bytes physical Rotation Rate: Solid State Device Form Factor: 2.5 inches Device is: Not in smartctl database [for details use: -P showall] ATA Version is: ACS-3 T13/2161-D revision 5 SATA Version is: SATA 3.2, 6.0 Gb/s (current: 6.0 Gb/s) Local Time is: Thu Jun 16 09:47:55 2022 CEST SMART support is: Available - device has SMART capability. SMART support is: Enabled === START OF READ SMART DATA SECTION === SMART overall-health self-assessment test result: PASSED General SMART Values: Offline data collection status: (0x00) Offline data collection activity was never started. Auto Offline Data Collection: Disabled. Self-test execution status: ( 0) The previous self-test routine completed without error or no self-test has ever been run. Total time to complete Offline data collection: ( 0) seconds. Offline data collection capabilities: (0x79) SMART execute Offline immediate. No Auto Offline data collection support. Suspend Offline collection upon new command. Offline surface scan supported. Self-test supported. Conveyance Self-test supported. Selective Self-test supported. SMART capabilities: (0x0003) Saves SMART data before entering power-saving mode. Supports SMART auto save timer. Error logging capability: (0x01) Error logging supported. General Purpose Logging supported. Short self-test routine recommended polling time: ( 1) minutes. Extended self-test routine recommended polling time: ( 2) minutes. Conveyance self-test routine recommended polling time: ( 2) minutes. SCT capabilities: (0x003d) SCT Status supported. SCT Error Recovery Control supported. SCT Feature Control supported. SCT Data Table supported. SMART Attributes Data Structure revision number: 1 Vendor Specific SMART Attributes with Thresholds: ID# ATTRIBUTE_NAME FLAG VALUE WORST THRESH TYPE UPDATED WHEN_FAILED RAW_VALUE 5 Reallocated_Sector_Ct 0x0032 100 100 000 Old_age Always - 0 9 Power_On_Hours 0x0032 100 100 000 Old_age Always - 607 12 Power_Cycle_Count 0x0032 100 100 000 Old_age Always - 15 170 Unknown_Attribute 0x0033 100 100 010 Pre-fail Always - 0 171 Unknown_Attribute 0x0032 100 100 000 Old_age Always - 0 172 Unknown_Attribute 0x0032 100 100 000 Old_age Always - 0 174 Unknown_Attribute 0x0032 100 100 000 Old_age Always - 8 175 Program_Fail_Count_Chip 0x0033 100 100 010 Pre-fail Always - 66811922837 183 Runtime_Bad_Block 0x0032 100 100 000 Old_age Always - 0 184 End-to-End_Error 0x0033 100 100 090 Pre-fail Always - 0 187 Reported_Uncorrect 0x0032 100 100 000 Old_age Always - 0 190 Airflow_Temperature_Cel 0x0022 065 062 000 Old_age Always - 35 (Min/Max 25/39) 192 Power-Off_Retract_Count 0x0032 100 100 000 Old_age Always - 8 194 Temperature_Celsius 0x0022 100 100 000 Old_age Always - 35 197 Current_Pending_Sector 0x0012 100 100 000 Old_age Always - 0 199 UDMA_CRC_Error_Count 0x003e 100 100 000 Old_age Always - 0 225 Unknown_SSD_Attribute 0x0032 100 100 000 Old_age Always - 57980 226 Unknown_SSD_Attribute 0x0032 100 100 000 Old_age Always - 30 227 Unknown_SSD_Attribute 0x0032 100 100 000 Old_age Always - 64 228 Power-off_Retract_Count 0x0032 100 100 000 Old_age Always - 36302 232 Available_Reservd_Space 0x0033 100 100 010 Pre-fail Always - 0 233 Media_Wearout_Indicator 0x0032 100 100 000 Old_age Always - 0 234 Unknown_Attribute 0x0032 100 100 000 Old_age Always - 0 235 Unknown_Attribute 0x0033 100 100 010 Pre-fail Always - 66811922837 241 Total_LBAs_Written 0x0032 100 100 000 Old_age Always - 57980 242 Total_LBAs_Read 0x0032 100 100 000 Old_age Always - 97397 243 Unknown_Attribute 0x0032 100 100 000 Old_age Always - 144726 SMART Error Log Version: 1 No Errors Logged SMART Self-test log structure revision number 1 No self-tests have been logged. [To run self-tests, use: smartctl -t] SMART Selective self-test log data structure revision number 1 SPAN MIN_LBA MAX_LBA CURRENT_TEST_STATUS 1 0 0 Not_testing 2 0 0 Not_testing 3 0 0 Not_testing 4 0 0 Not_testing 5 0 0 Not_testing Selective self-test flags (0x0): After scanning selected spans, do NOT read-scan remainder of disk. If Selective self-test is pending on power-up, resume after 0 minute delay.smartctl -a /dev/sdc smartctl 6.5 2016-05-07 r4318 [x86_64-linux-4.19.0+1] (local build) Copyright (C) 2002-16, Bruce Allen, Christian Franke, www.smartmontools.org === START OF INFORMATION SECTION === Model Family: Seagate Barracuda 2.5 5400 Device Model: ST4000LM024-2AN17V Serial Number: WCK8GFTY LU WWN Device Id: 5 000c50 0e04fd944 Firmware Version: 0001 User Capacity: 4.000.787.030.016 bytes [4,00 TB] Sector Sizes: 512 bytes logical, 4096 bytes physical Rotation Rate: 5526 rpm Form Factor: 2.5 inches Device is: In smartctl database [for details use: -P show] ATA Version is: ACS-3 T13/2161-D revision 5 SATA Version is: SATA 3.1, 6.0 Gb/s (current: 6.0 Gb/s) Local Time is: Thu Jun 16 09:48:22 2022 CEST SMART support is: Available - device has SMART capability. SMART support is: Enabled === START OF READ SMART DATA SECTION === SMART overall-health self-assessment test result: PASSED General SMART Values: Offline data collection status: (0x00) Offline data collection activity was never started. Auto Offline Data Collection: Disabled. Self-test execution status: ( 0) The previous self-test routine completed without error or no self-test has ever been run. Total time to complete Offline data collection: ( 0) seconds. Offline data collection capabilities: (0x73) SMART execute Offline immediate. Auto Offline data collection on/off support. Suspend Offline collection upon new command. No Offline surface scan supported. Self-test supported. Conveyance Self-test supported. Selective Self-test supported. SMART capabilities: (0x0003) Saves SMART data before entering power-saving mode. Supports SMART auto save timer. Error logging capability: (0x01) Error logging supported. General Purpose Logging supported. Short self-test routine recommended polling time: ( 1) minutes. Extended self-test routine recommended polling time: ( 659) minutes. Conveyance self-test routine recommended polling time: ( 2) minutes. SCT capabilities: (0x30a5) SCT Status supported. SCT Data Table supported. SMART Attributes Data Structure revision number: 10 Vendor Specific SMART Attributes with Thresholds: ID# ATTRIBUTE_NAME FLAG VALUE WORST THRESH TYPE UPDATED WHEN_FAILED RAW_VALUE 1 Raw_Read_Error_Rate 0x000f 081 064 006 Pre-fail Always - 118330775 3 Spin_Up_Time 0x0003 100 099 000 Pre-fail Always - 0 4 Start_Stop_Count 0x0032 100 100 020 Old_age Always - 20 5 Reallocated_Sector_Ct 0x0033 100 100 010 Pre-fail Always - 0 7 Seek_Error_Rate 0x000f 081 060 045 Pre-fail Always - 134329070 9 Power_On_Hours 0x0032 100 100 000 Old_age Always - 606 (32 213 0) 10 Spin_Retry_Count 0x0013 100 100 097 Pre-fail Always - 0 12 Power_Cycle_Count 0x0032 100 100 020 Old_age Always - 19 183 SATA_Downshift_Count 0x0032 100 100 000 Old_age Always - 0 184 End-to-End_Error 0x0032 100 100 099 Old_age Always - 0 187 Reported_Uncorrect 0x0032 100 100 000 Old_age Always - 0 188 Command_Timeout 0x0032 100 100 000 Old_age Always - 0 189 High_Fly_Writes 0x003a 100 100 000 Old_age Always - 0 190 Airflow_Temperature_Cel 0x0022 063 062 040 Old_age Always - 37 (Min/Max 29/38) 191 G-Sense_Error_Rate 0x0032 100 100 000 Old_age Always - 0 192 Power-Off_Retract_Count 0x0032 100 100 000 Old_age Always - 0 193 Load_Cycle_Count 0x0032 097 097 000 Old_age Always - 6920 194 Temperature_Celsius 0x0022 037 040 000 Old_age Always - 37 (0 17 0 0 0) 195 Hardware_ECC_Recovered 0x001a 081 064 000 Old_age Always - 118330775 197 Current_Pending_Sector 0x0012 100 100 000 Old_age Always - 0 198 Offline_Uncorrectable 0x0010 100 100 000 Old_age Offline - 0 199 UDMA_CRC_Error_Count 0x003e 200 200 000 Old_age Always - 0 240 Head_Flying_Hours 0x0000 100 253 000 Old_age Offline - 562 (116 178 0) 241 Total_LBAs_Written 0x0000 100 253 000 Old_age Offline - 16861005126 242 Total_LBAs_Read 0x0000 100 253 000 Old_age Offline - 11745641547 254 Free_Fall_Sensor 0x0032 100 100 000 Old_age Always - 0 SMART Error Log Version: 1 No Errors Logged SMART Self-test log structure revision number 1 No self-tests have been logged. [To run self-tests, use: smartctl -t] SMART Selective self-test log data structure revision number 1 SPAN MIN_LBA MAX_LBA CURRENT_TEST_STATUS 1 0 0 Not_testing 2 0 0 Not_testing 3 0 0 Not_testing 4 0 0 Not_testing 5 0 0 Not_testing Selective self-test flags (0x0): After scanning selected spans, do NOT read-scan remainder of disk. If Selective self-test is pending on power-up, resume after 0 minute delay.that is the first host (i have only 1 raid on the ssd and 1 single hdd on this host)
it takes about 3-4sec for smartctl to display the data there
-
All disks are taking 3/4 sec to display smartctl ?
-
@olivierlambert
only the 4TB hdd. i also have testet it on the other dom0, there it's quicker. Maybe it's related because there are some running rsyncs on a virtual machine to this disk. -
@olivierlambert definitely doesn't ring any bells but definitely smells like a storage issue, I would test disk performance directly in dom0 on the RAID SR using something like FIO, although we don't provide this in our repos so that would be difficult to get in dom0. perhaps a simple dd speed test under the SR mount directly, you should be able to find it by running
df -h. Just be sure you don't overwrite any VM disk files -
i would agree that it sounds like an storage problem, but it's unlikley that this happends on 2 brand new machines at the same time and the dom0 should be affected with the same problems when it's a hardware case.
What does this "vif vif-5-1 vif5.1: Guest Rx stalled" mean? Rx stand for some information recieve?
-
@Andi79 it's impossible to say without more testing, it could be a firmware issue on these boards causing IO stalls or similar, the only way to be sure now is to run some perf tests inside dom0 to confirm it's not VM related, once you get that confirmation, install (or live boot) plain CentOS on one of the machine and test there as well. Are both the SSD and the HDD underneath an mdadm software raid? I suppose it could be a software raid configuration issue as well, but it's hard to say without further testing
-
@Andi79 the guest RX messages are normal, some OSs like debian etc put unused interfaces in some type of "sleep" mode if I remember correctly and this causes these harmless messages
-
I am no expert here but I had vm crashing on me before when transfering data and it was because the VM started its life with a very large amount of RAM. Then it was reduce and the setting in Memory limits (min/max) was messed up.
What do you have for Memory limits (min/max) and what is the current VM memory? -
on machine 1 the SSDs (sda/sdb) are a raid 1, the 4tb hdd is no raid
on machine 2 there is sda/sdb the 960GB SSD raid 1, sdc/sdd a 4TB raid 1all raids are software raids. On Machine 1 all configuration was done by xcp-ng during installation, on machine 2 it didn't work to create 2 raids by installer, so i configured it manually during installation
server 1:
 mdadm --detail /dev/md127
/dev/md127:
           Version : 1.0
     Creation Time : Fri May 13 00:42:01 2022
        Raid Level : raid1
        Array Size : 937692352 (894.25 GiB 960.20 GB)
     Used Dev Size : 937692352 (894.25 GiB 960.20 GB)
      Raid Devices : 2
     Total Devices : 2
       Persistence : Superblock is persistent

     Intent Bitmap : Internal

       Update Time : Thu Jun 16 10:54:29 2022
             State : active
    Active Devices : 2
   Working Devices : 2
    Failed Devices : 0
     Spare Devices : 0

Consistency Policy : bitmap

              Name : localhost:127
              UUID : 3291ed43:84e67acd:d548e8e9:3de5fa57
            Events : 3738

    Number   Major   Minor   RaidDevice State
       0       8        0        0      active sync   /dev/sda
       1       8       16        1      active sync   /dev/sdb
pvs Device read short 82432 bytes remaining Device read short 82432 bytes remaining Device read short 40960 bytes remaining WARNING: Not using device /dev/sda3 for PV hmMtFH-xKzv-cAXc-6Ezc-WKhT-TAna-ctQUxC. WARNING: PV hmMtFH-xKzv-cAXc-6Ezc-WKhT-TAna-ctQUxC prefers device /dev/md127p3 because device is used by LV. PV VG Fmt Attr PSize PFree /dev/md127p3 VG_XenStorage-745f4736-e407-1a8d-35f2-aa08309722d3 lvm2 a-- <852,74g 418,89g /dev/sdc VG_XenStorage-51542fdd-2993-3d0f-9edb-1a3fa03227b6 lvm2 a-- <3,64t <1,41tServer 2:
mdadm --detail /dev/md127
/dev/md127:
           Version : 1.0
     Creation Time : Sat Jun  4 09:56:54 2022
        Raid Level : raid1
        Array Size : 937692352 (894.25 GiB 960.20 GB)
     Used Dev Size : 937692352 (894.25 GiB 960.20 GB)
      Raid Devices : 2
     Total Devices : 2
       Persistence : Superblock is persistent

     Intent Bitmap : Internal

       Update Time : Thu Jun 16 11:00:07 2022
             State : clean
    Active Devices : 2
   Working Devices : 2
    Failed Devices : 0
     Spare Devices : 0

Consistency Policy : bitmap

              Name : localhost:127
              UUID : b5ab10b2:b89109af:9f4a274a:d7af50b3
            Events : 4450

    Number   Major   Minor   RaidDevice State
       0       8       32        0      active sync   /dev/sdc
       1       8       48        1      active sync   /dev/sdd
mdadm --detail /dev/md126 /dev/md126: Version : 1.2 Creation Time : Sat Jun 4 12:08:56 2022 Raid Level : raid1 Array Size : 3906886464 (3725.90 GiB 4000.65 GB) Used Dev Size : 3906886464 (3725.90 GiB 4000.65 GB) Raid Devices : 2 Total Devices : 2 Persistence : Superblock is persistent Intent Bitmap : Internal Update Time : Thu Jun 16 10:58:21 2022 State : active Active Devices : 2 Working Devices : 2 Failed Devices : 0 Spare Devices : 0 Consistency Policy : bitmap Name : klartext2-neu:md126 (local to host klartext2-neu) UUID : 784c25d6:18f3a0c2:ca8fe399:d16ec0e2 Events : 35384 Number Major Minor RaidDevice State 0 8 0 0 active sync /dev/sda 1 8 16 1 active sync /dev/sdb -
some tests:
Server 1 / dom0:
#dd if=/dev/zero of=/root/test bs=512 count=10000
10000+0 Datensätze ein
10000+0 Datensätze aus
5120000 Bytes (5,1 MB) kopiert, 0,0339501 s, 151 MB/s
Server 1 / VM 1:
#dd if=/dev/zero of=/root/test bs=512 count=10000
10000+0 records in
10000+0 records out
5120000 bytes (5,1 MB, 4,9 MiB) copied, 5,41172 s, 946 kB/s
it really seems to be VM related, but I don't see any reason why
-
I tested it one VM2 that's on the ssd
dd if=/dev/zero of=/root/test bs=512 count=10000
10000+0 records in
10000+0 records out
5120000 bytes (5,1 MB, 4,9 MiB) copied, 0,0153181 s, 334 MB/s
and on VM3, also hdd
dd if=/dev/zero of=/root/test bs=512 count=10000
10000+0 records in
10000+0 records out
5120000 bytes (5,1 MB) copied, 0,00494598 s, 1,0 GB/s
and on VM4, hdd
#dd if=/dev/zero of=/root/test bs=512 count=10000
10000+0 records in
10000+0 records out
5120000 bytes (5,1 MB, 4,9 MiB) copied, 82,3517 s, 62,2 kB/s (stopped)
the difference is that the first VM and the last VM have running backups with rsync... VM2 and VM3 are on very low load at the moment.
it occurs when there is runing anything on the machines
-
@fred974 they have 6 - 10GB Ram, but it's not memory related. It's some kind of strange IO Problem that blocks the whole VM that must be some combination of things. The VMs worked without any problems on other hosts, but the Host itself doesn't have any problems (and because there are 2 of them hardware problems are very unlikley).
-
perhaps this helps.
dom0
mpstat -P ALL
Linux 4.19.0+1 (klartext1) 	16.06.2022 	_x86_64_	(12 CPU)

12:00:43     CPU    %usr   %nice    %sys %iowait    %irq   %soft  %steal  %guest  %gnice   %idle
12:00:43     all    0,58    0,00    0,89    0,03    0,00    0,37    0,39    0,00    0,00   97,74
12:00:43       0    0,57    0,00    1,14    0,02    0,00    1,50    0,38    0,00    0,00   96,39
12:00:43       1    0,58    0,00    0,85    0,06    0,00    0,07    0,40    0,00    0,00   98,04
12:00:43       2    0,57    0,00    0,85    0,04    0,00    0,11    0,39    0,00    0,00   98,03
12:00:43       3    0,57    0,00    0,85    0,02    0,00    0,26    0,39    0,00    0,00   97,91
12:00:43       4    0,55    0,00    0,86    0,02    0,00    0,49    0,38    0,00    0,00   97,69
12:00:43       5    0,61    0,00    0,88    0,03    0,00    0,17    0,39    0,00    0,00   97,91
12:00:43       6    0,60    0,00    0,94    0,03    0,00    0,92    0,40    0,00    0,00   97,11
12:00:43       7    0,56    0,00    0,84    0,02    0,00    0,05    0,40    0,00    0,00   98,13
12:00:43       8    0,56    0,00    0,84    0,02    0,00    0,29    0,40    0,00    0,00   97,89
12:00:43       9    0,57    0,00    0,84    0,02    0,00    0,15    0,40    0,00    0,00   98,03
12:00:43      10    0,56    0,00    0,85    0,02    0,00    0,33    0,40    0,00    0,00   97,83
12:00:43      11    0,63    0,00    0,91    0,02    0,00    0,09    0,40    0,00    0,00   97,94
vm1:
mpstat -P ALL
Linux 5.15.0-37-generic (backup1) 	16.06.2022 	_x86_64_	(12 CPU)

10:02:33     CPU    %usr   %nice    %sys %iowait    %irq   %soft  %steal  %guest  %gnice   %idle
10:02:33     all    0,16    0,01    0,06   28,98    0,00    0,03    0,05    0,00    0,00   70,72
10:02:33       0    0,08    0,01    0,02   12,98    0,00    0,00    0,01    0,00    0,00   86,89
10:02:33       1    0,30    0,02    0,09   42,83    0,00    0,00    0,02    0,00    0,00   56,74
10:02:33       2    0,18    0,01    0,07   32,57    0,00    0,00    0,02    0,00    0,00   67,15
10:02:33       3    0,20    0,01    0,09   47,56    0,00    0,04    0,08    0,00    0,00   52,01
10:02:33       4    0,16    0,01    0,05   28,91    0,00    0,00    0,01    0,00    0,00   70,85
10:02:33       5    0,14    0,01    0,04   20,90    0,00    0,00    0,01    0,00    0,00   78,90
10:02:33       6    0,16    0,02    0,04   22,59    0,00    0,00    0,03    0,00    0,00   77,17
10:02:33       7    0,08    0,01    0,03   17,02    0,00    0,00    0,01    0,00    0,00   82,85
10:02:33       8    0,08    0,00    0,03   17,85    0,00    0,00    0,01    0,00    0,00   82,02
10:02:33       9    0,09    0,01    0,04   18,09    0,00    0,00    0,03    0,00    0,00   81,74
10:02:33      10    0,31    0,01    0,13   47,49    0,00    0,26    0,37    0,00    0,00   51,43
10:02:33      11    0,12    0,01    0,05   39,03    0,00    0,00    0,02    0,00    0,00   60,76
very high io wait.... but low usr that should be higher because of running rsyncs on user level
-
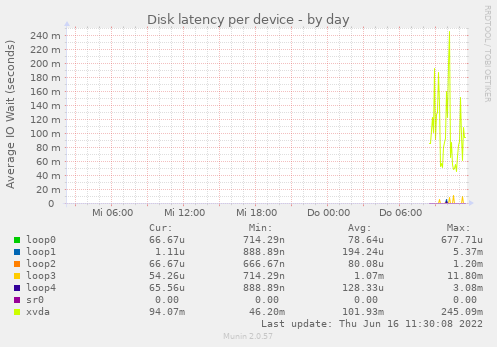
reported by munin on the slow VM. xvda has a latency ok 100ms. The problem occurs when there are many small file request like rsync does... and 100ms in sum is a lot. Any idea how I could debug the reason for this?
-
To me the issue is with a physical disk in your host, that's used then for your VM.
Having much latency on the
smartctlcommand isn't a good sign. -
actually it looks like that the 4TB on Server 1 really has hardware problems.... and the reason why there was the same effect on the other dom is that there was an mounted NFS Share of an machine on the first server..... and the disk errors on this machine where "transfered" to the other dom with the same affects (delaying the whole system).
I'm currently migrating all VMs von server1 to server2. I really hope that is the
solution for all. Currently rsync is not running on any machine... i will test this later when the VMs are transfered.
Hello! It looks like you're interested in this conversation, but you don't have an account yet.
Getting fed up of having to scroll through the same posts each visit? When you register for an account, you'll always come back to exactly where you were before, and choose to be notified of new replies (either via email, or push notification). You'll also be able to save bookmarks and upvote posts to show your appreciation to other community members.
With your input, this post could be even better 💗
Register Login