Storage IOPS and throughput dropouts?
-
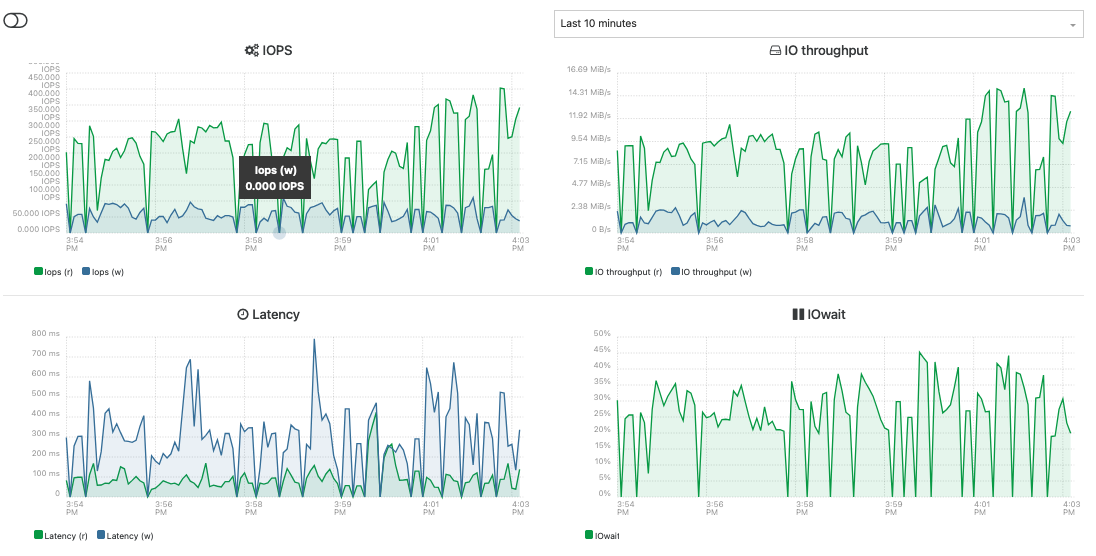
In my throughput/IO graphs on Xen Orchestra, I'm seeing these spikes of 0 IOPS, 0 throughput, 0 latency, 0 IOWait. What I don't know is whether this is some kind of graphing artifact (i.e., it's not really happening, but the graph makes it look like it's happening), or whether I'm experiencing some kind of underlying hard disk throughput issue.
I'm in the middle of migrating a VM and it's estimating 12 hours to move 100G, which is long. I moved a couple 20G VMs this morning at 15-20 minutes each.
My question is, where could I look in XCP-ng logs to investigate? How could I get a sense of whether I'm really running into problems here? I've looked at these graphs many times over the years, and these spikes are new. This hasn't always looked like this.
Any thoughts?
The underlying storage is a LSI 9266-8i SAS RAID controller with 3 hard disks in a RAID5 array (hardware raid). I don't think I'm experiencing any other major issues, but maybe I am and don't know how to see it?
I'm running XCP-ng 8.2.1 and Xen Orchestra built from sources (well, from ronivay's Docker container) Xen Orchestra, commit e75cc Master, commit 70014.
-
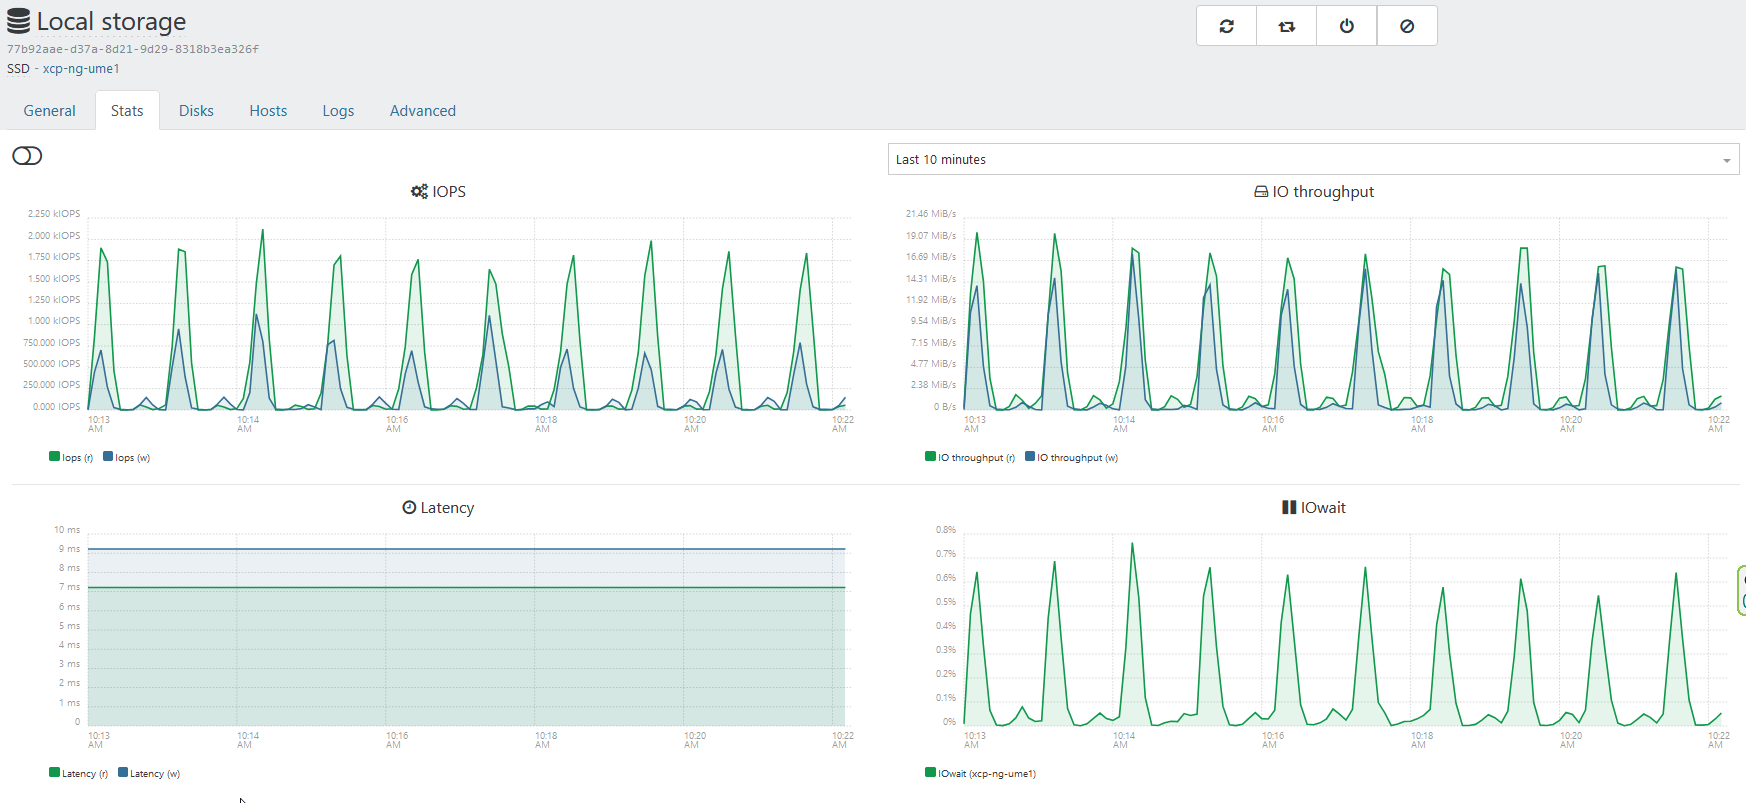
I have the same thing if im on the "Last 10 minutes" view, if I switch to any other view the graphs are more even. Im 100% sure I dont have a performance issue with my RAID6 SSD array, yet my graphs looks like yours with the "spikes":
-
Hi,
Do you have any functional issues in the first place?
-
@nikade You misunderstand. I am calling them "spikes", which most people use that word to mean things going dramatically up. Your graph shows spikes going up. Look closely at my graph, including the point I have highlighted. These "spikes" are 0. That is, it's humming along and then suddenly there's a spike down to 0. That's unlikely because the system is plenty active. So your graph shows spikes up, which is normal. Mine is showing occassional drops to 0, which is what I'm asking about.
-
@olivierlambert Nothing dramatic. Just things "feeling slower than usual." That's qualititative. Just a gut hunch. So that's why I'm asking about ways to test or investigate.
-
@paco said in Storage IOPS and throughput dropouts?:
@nikade You misunderstand. I am calling them "spikes", which most people use that word to mean things going dramatically up. Your graph shows spikes going up. Look closely at my graph, including the point I have highlighted. These "spikes" are 0. That is, it's humming along and then suddenly there's a spike down to 0. That's unlikely because the system is plenty active. So your graph shows spikes up, which is normal. Mine is showing occassional drops to 0, which is what I'm asking about.
What happends if you choose another period? For example the hourly or daily?
I can agree with the spiking up vs. down - I didnt even reflect about that, looks a bit strange.I've now checked every SR at work and I can only see a similar graph on one of our hosts, which is pretty idle. It is a local RAID6 and the VM's on there feel pretty snappy:
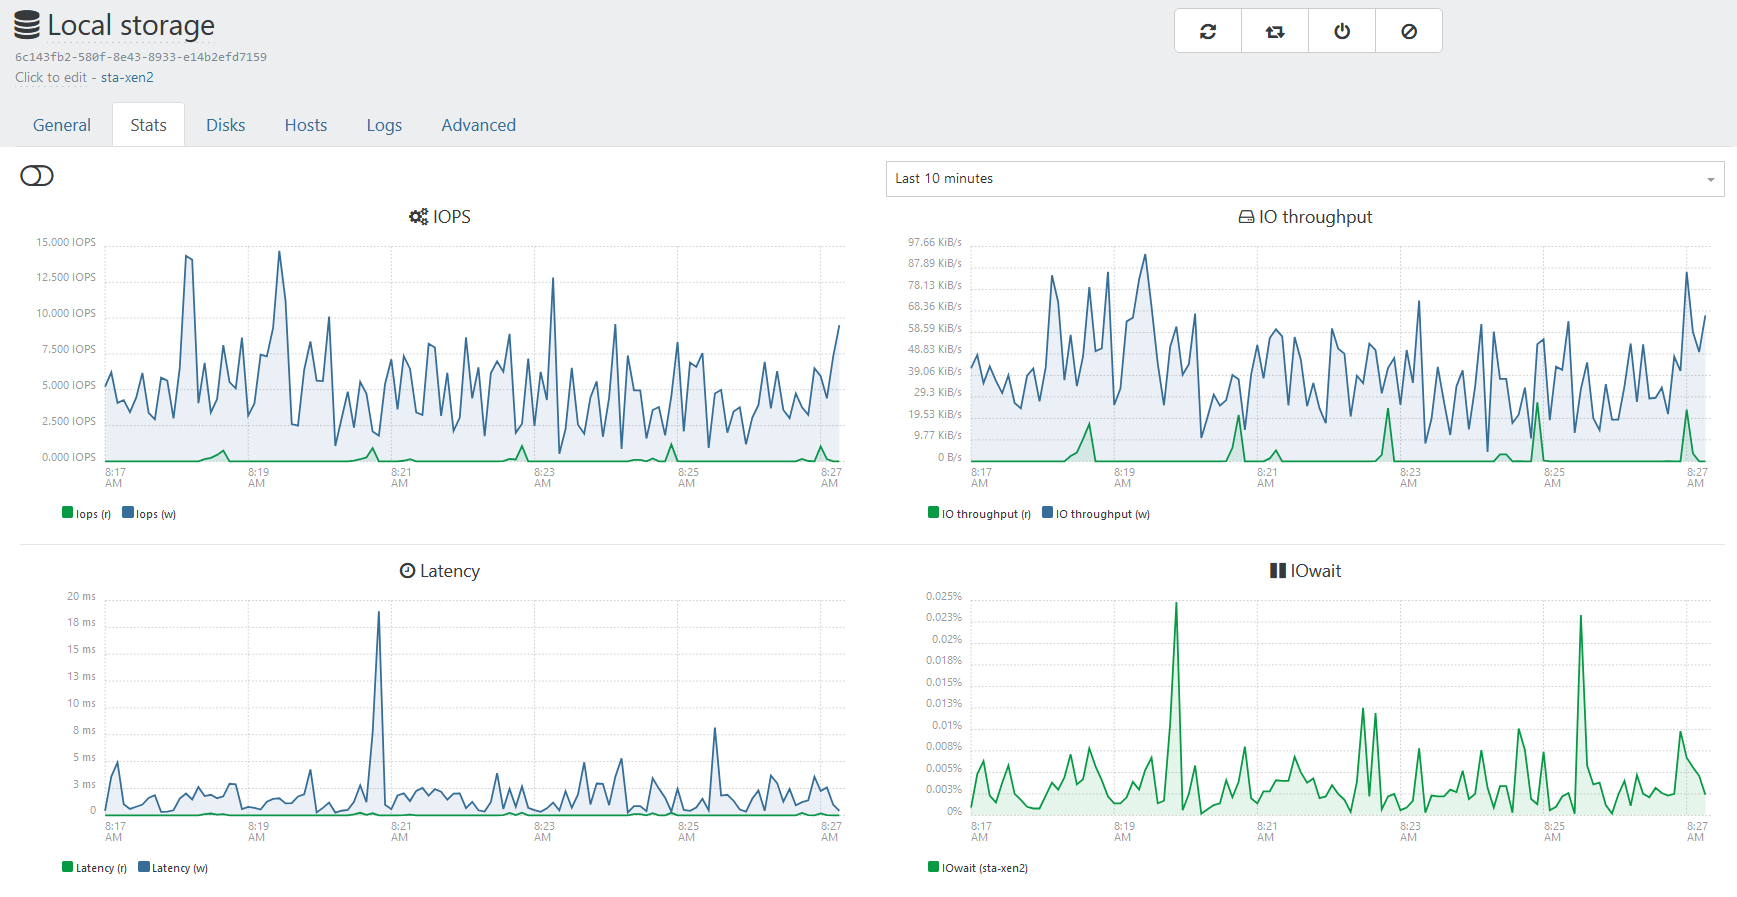
Im starting to think if this has anything to do with write-cache on the RAID-controller. When I check our shared SR's there is nothing like this.
-
@nikade Short answer is that the spikes seem to have smoothed out. I'm not really sure what happened. I don't have them at any resolution now. Perhaps some kind of heisenbug.
-
@paco said in Storage IOPS and throughput dropouts?:
@nikade Short answer is that the spikes seem to have smoothed out. I'm not really sure what happened. I don't have them at any resolution now. Perhaps some kind of heisenbug.
Happy to hear that
")
Hello! It looks like you're interested in this conversation, but you don't have an account yet.
Getting fed up of having to scroll through the same posts each visit? When you register for an account, you'll always come back to exactly where you were before, and choose to be notified of new replies (either via email, or push notification). You'll also be able to save bookmarks and upvote posts to show your appreciation to other community members.
With your input, this post could be even better 💗
Register Login