Custom Netdata configuration to send metrics to an InfluxDB
-
Hello, I have Netdata running on my host. I want to configure it to sends the metrics to an InfluxDB server.
I do this on regular Linux hosts so I know my configuration for Netdata works.
I tried putting this in /etc/netdata/netdata.conf and restarting and it's not sending anything. I can't find errors in logs.
So I am wondering if I am modifying the wrong file.
Any input or idea would be welcome!
-
Are you sure it's compatible with the Netdata version on the host?
-
As best I can tell, yes. From the /var/log/netdata I gathered it's running 1.44.1
From the docs I found in GitHub for Netdata at 1.44:
https://github.com/netdata/netdata/blob/v1.44/docs/export/enable-connector.md
It's possible - I use
opentsdb. -
I am not finding much in the logs which led me to wonder if I am modifying the right config file.
-
Honestly, this is just one way to solve what I am trying to do... I am trying to have the Host metrics (host CPU usage) in Grafana to plot on a dashboard along side other data.
Having the data in InfluxDB is not necessarily the goal here. Just a way to reach it. I am running a fairly old version of Grafana.
-
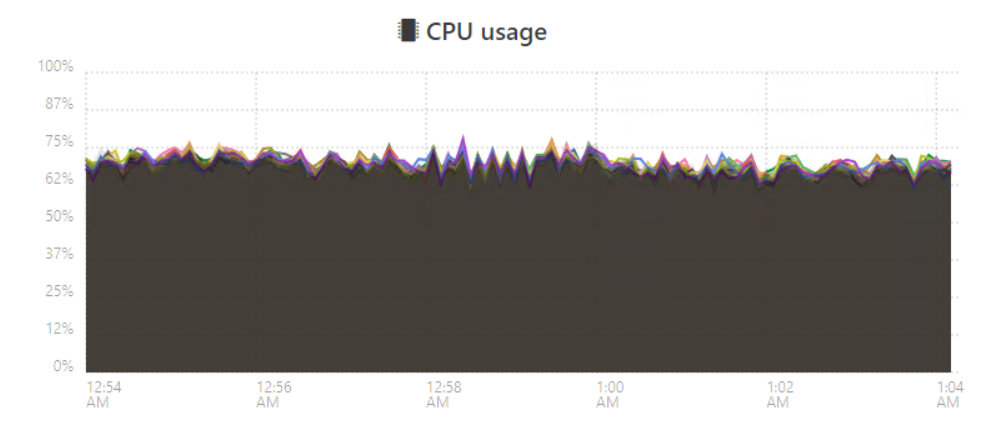
Perhaps Netdata isn't the right way either - does not seem to give me the right CPU metrics:
Netdata:
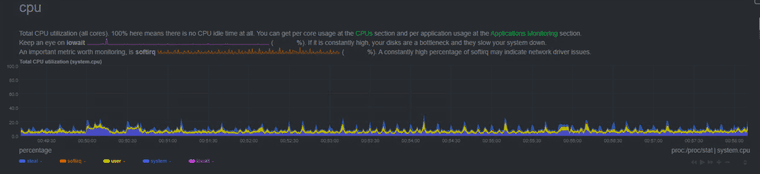
XenOrchestra:
-
@etlweather So pushing the metrics to Prometheus could also do the trick, right? I think there's a program out there doing this, do you remember @TeddyAstie ?
-
@etlweather isnt netdata just monitoring dom0 cpu, not xen hypervisor itswlf.
-
@Forza I don't know, I guess that's part of what I am trying to find out. How to get the metrics of the physical cpu usage. I thought that's what I would get with activating Netdata (Advanced Telemetry) from XenOrchestra.
Hello! It looks like you're interested in this conversation, but you don't have an account yet.
Getting fed up of having to scroll through the same posts each visit? When you register for an account, you'll always come back to exactly where you were before, and choose to be notified of new replies (either via email, or push notification). You'll also be able to save bookmarks and upvote posts to show your appreciation to other community members.
With your input, this post could be even better 💗
Register Login