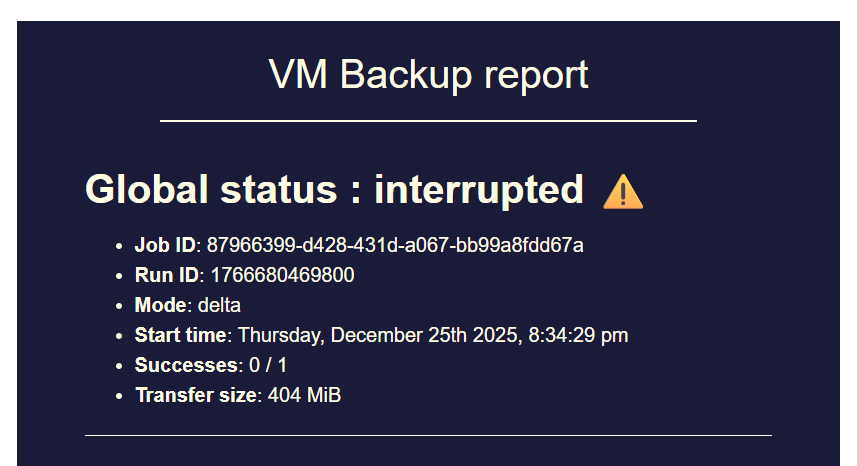
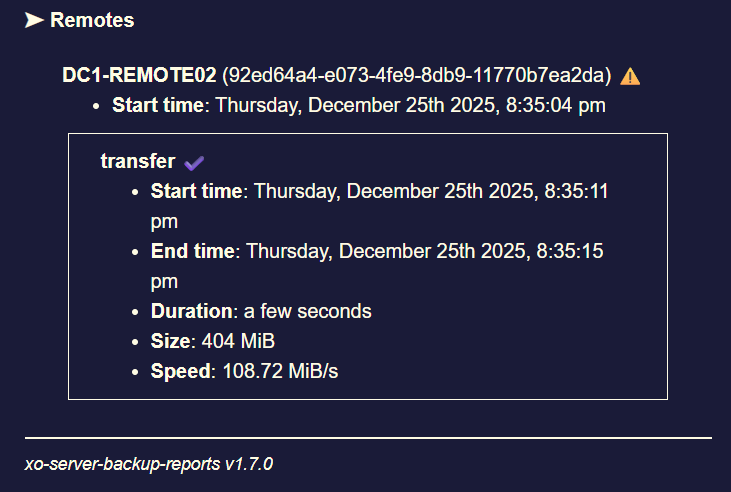
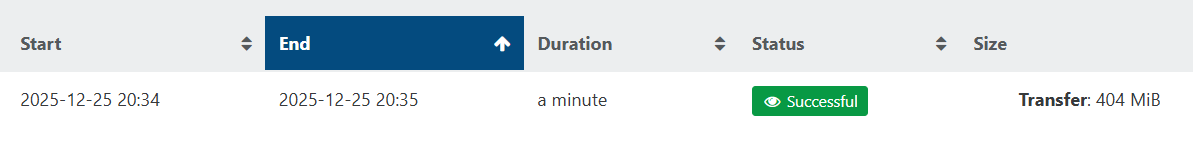
backup mail report says INTERRUPTED but it's not ?
-
@Pilow said in backup mail report says INTERRUPTED but it's not ?:
@MajorP93 probably irrelevant, but since end of december I noticed a memory-leak behavior on my XOA.
I finally put up a job to restart it everyday 4.15am, otherwise at about 48h it was saturating it's RAM (8Gb...)
no more problem with a reboot everyday but, something is cooking.
Are you using NodeJS 22 or 24 for your instance of XO?
As both of these have the issue, only it’s much worse for NodeJS 24. Only the NodeJS 20 as an LTS is the currently released one which has stable and predictable memory usage.
-
@john.c Considering how widely Node JS is being used out there I highly doubt that memory management in itself is broken in Node 22 and 24.
If that would be the case it would have been covered by IT bloggers and most users would switch to using something else.
Classifying memory management as unstable for the whole LTS branches 22 and 24 is something a LLM would do.
I think it is more likely a XO + Node issue.
@pilow already said that they are using XOA which (AFAIK) is still using Node 20.
Even on Node 20 there seems to be some memory leak ongoing according to them which is why it being a "XO + Node" issue rather than a Node 22/24 being borked in general becomes even more likely.//EDIT: even if using Node 20 would improve anything here, sticking with it might not be the best idea as Node 20 will become EOL in April 2026.
-
@MajorP93 said in backup mail report says INTERRUPTED but it's not ?:
@john.c Considering how widely Node JS is being used out there I highly doubt that memory management in itself is broken in Node 22 and 24.
If that would be the case it would have been covered by IT bloggers and most users would switch to using something else.
Classifying memory management as unstable for the whole LTS branches 22 and 24 is something a LLM would do.
I think it is more likely a XO + Node issue.
@pilow already said that they are using XOA which (AFAIK) is still using Node 20.
Even on Node 20 there seems to be some memory leak ongoing according to them which is why it being a "XO + Node" issue rather than a Node 22/24 being borked in general becomes even more likely.//EDIT: even if using Node 20 would improve anything here, sticking with it might not be the best idea as Node 20 will become EOL in April 2026.
@bastien-nollet @florent @olivierlambert It takes placing enough stress on those certain areas, to trigger RSS spikes in NodeJS 22 and 24. It’s happened and/or happening to other developers who use NodeJS.
Just to clarify a few things from the earlier AI‑generated reply:
In this case we are not dealing with a kernel OOM kill. The log I attached in my first post clearly shows a Node‑level heap out‑of‑memory error. So statements like “No crash logs = kernel OOM” don’t apply here.
That said, it is still worth looking into Node 22/24 memory behavior, but not because those LTS branches are “broken.” If Node’s memory management were fundamentally unstable, the entire ecosystem would be in chaos. Instead, what seems more likely is:
XO’s backup workload + Node 22/24 = hitting a known memory‑management edge case.
This is supported by the fact that even XOA (which uses Node 20) is showing signs of a slow leak according to @pilow. That strongly suggests the issue is not “Node 22/24 bad,” but rather:
“XO + Node” interaction that becomes more visible under newer V8 versions.
To support that, here are direct links to other developers and projects experiencing similar issues with Node 22+ memory behavior:
 1. Cribl’s deep dive into Node 22 memory regressions
They observed significantly higher RSS and memory anomalies when upgrading from Node 20 → 22, and ended up contributing fixes upstream.
“Understanding Node.js 22 memory behavior and our upstream contribution”
https://cribl.io/blog/understanding-node-js-22-memory-behavior-and-our-upstream-contribution/ (cribl.io in Bing)
This is one of the clearest real‑world examples of a production workload exposing V8 memory issues that didn’t appear in Node 20.
2. Node.js upstream issue: RetainedMaps memory leak in Node 22
This is a confirmed V8‑level leak that affected Node 22 until fixed upstream.
GitHub Issue #57412 — “Memory leak due to increasing RetainedMaps size in V8 (Fixed upstream)”
https://github.com/nodejs/node/issues/57412 (github.com in Bing)
This shows that Node 22+ did have real memory regressions, even if they don’t affect all workloads.
3. Broader discussions about increased RSS in modern Node/V8
There are multiple reports of higher RSS and “apparent leaks” in Node 22+ under heavy async I/O, streaming, or buffer‑intensive workloads — which is exactly what XO’s backup pipeline does.
Examples include:
Matteo Collina’s posts on V8 memory behavior and GC tuning
Various debugging guides for Node 22 memory regressions
Reports from teams running high‑throughput streaming workloads
These aren’t XO‑specific, but they show the pattern is real.Why this matters for XO?
XO’s backup pipeline is unusually heavy for a Node application:
- large streaming buffers
- compression
- encryption
- S3 multipart uploads
- high concurrency
- long‑lived async chains
This is exactly the kind of workload that tends to surface V8 memory issues that don’t appear in typical web servers or CLIs.
And since Node 20 goes EOL in April 2026, XO will eventually need to run reliably on Node 22/24 or an alternative runtime.
So the more accurate framing is:
This is not a kernel OOM.
This is a Node heap OOM, confirmed by the logs.
Node 22/24 are not globally unstable, but they do have documented memory regressions and behavior changes.
XO’s backup workload is heavy enough to expose those issues.
Even Node 20 shows a slow leak in XOA, which strongly suggests a XO + Node interaction, not a Node‑only problem.
Investigating Node 22/24 memory behavior is still worthwhile because XO recommends using the latest LTS.
Long‑term, XO may need fixes, profiling, or architectural adjustments to run reliably on future Node versions. -
Okay, to update on my findings:
According to the log lines
[40:0x2e27d000] 312864931 ms: Scavenge 2011.2 (2033.4) -> 2005.3 (2033.6) MB, pooled: 0 MB, 2.31 / 0.00 ms  (average mu = 0.257, current mu = 0.211) task;
[40:0x2e27d000] 312867125 ms: Mark-Compact (reduce) **2023.6** (2044.9) -> **2000.5 (2015.5)** MB, pooled: 0 MB, 83.33 / 0.62 ms  (+ 1867.4 ms in 298 steps since start of marking, biggest step 19.4 ms, walltime since start of marking 2194 ms) (average mu = 0.333,
FATAL ERROR: Ineffective mark-compacts near heap limit Allocation failed - JavaScript heap out of memory
The default heap size seems to be 2GB. I read some Node documentation regarding heap size and understood that configured heap size is honored on a per-process basis.
XO backup seems to spawn multiple node processes (workers) which is why I figured the value I previously set as an attempt to fix my issue was too high (max-old-space-size=6144), 6GB can cause OOM quickly when multiple Node processes are being spawned.For now I added 512MB to the default heap which results in my heap totaling to 2.5GB.
I hope that this will suffice for my backup jobs to not fail as my log clearly indicated the cause of the Node OOM was the heap ceiling being touched.If it was caused by Node 22+ RSS there would be other log entries.
Also I was thinking a bit more about what @pilow said and I think I observed something similar.
Due to the "interrupted" issue already occurring a few weeks back I checked "htop" once in a while on my XO VM and noticed that after backup jobs completed the RAM usage not really goes down to the value it was sitting before.
After a fresh reboot of my XO VM RAM usage sits at around 1GB.
During backups it showed around 6GB of 10GB total being used.
After backups finished XO VM was sitting at around 5GB of RAM.
So yeah maybe there is a memory leak somewhere after all.Anyhow I will keep monitoring this and see if the increased heap makes backup jobs more robust.
Would still be interesting to hear something from XO team in this regard.
Best regards
MajorP -
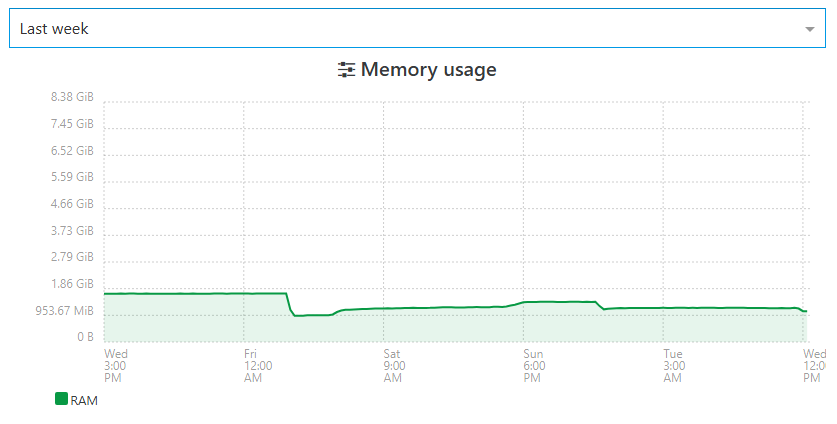
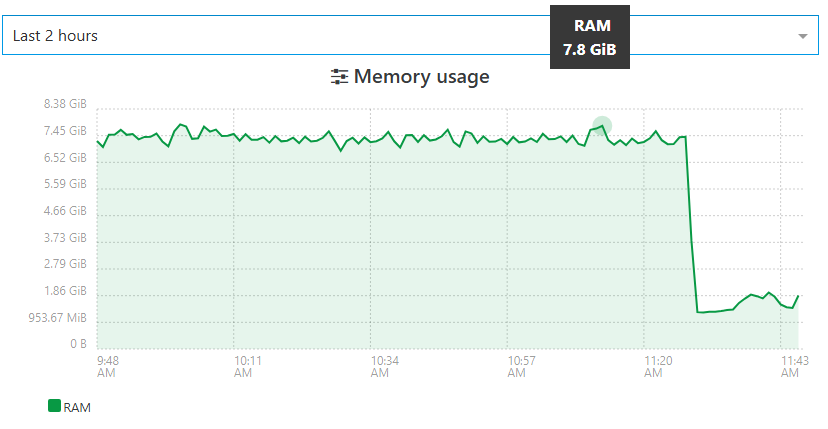
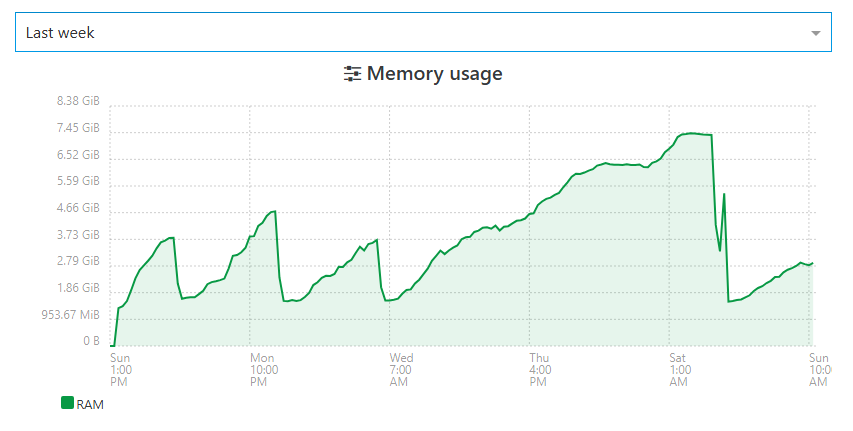
@MajorP93 here are some screenshots of my XOA RAM
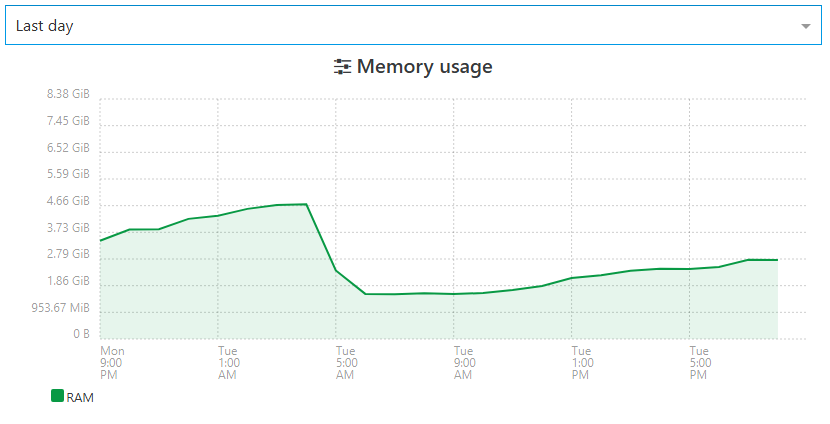
(lost before sunday stats since I crashed my host in RPU this weekend...)
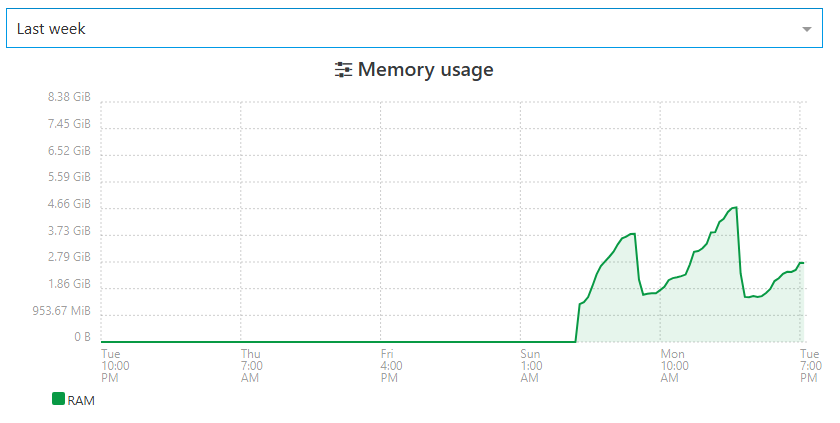
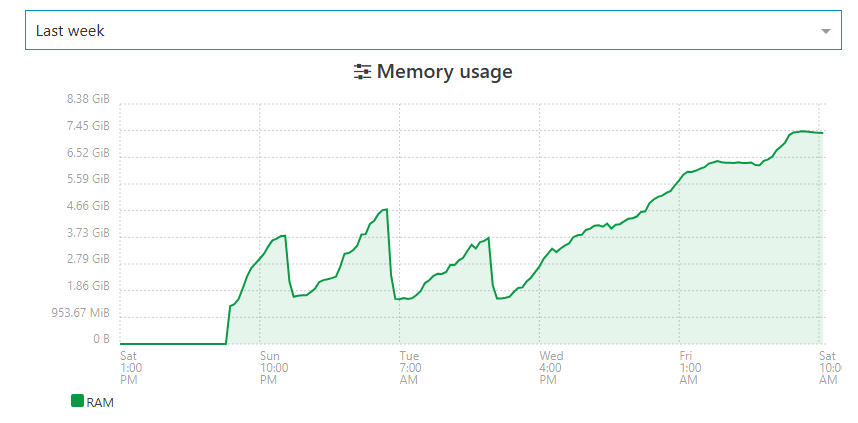
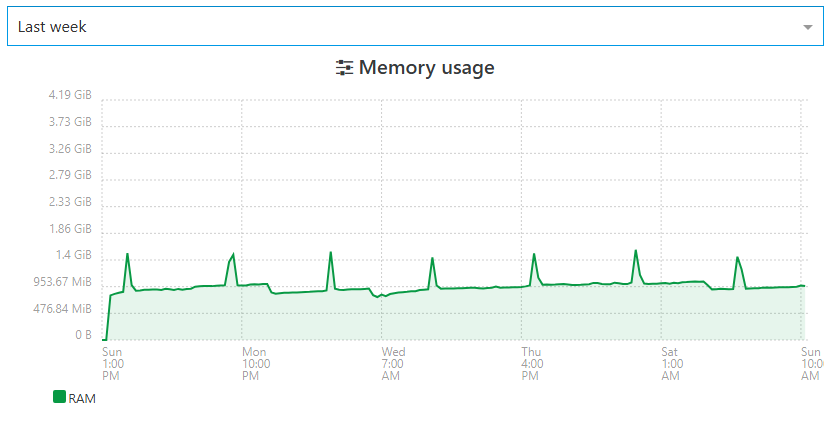
you can clearly see RAM crawling and beeing dumped each reboot.here is one of my XOA Proxies (4 in total, they totally offload backups from my main XOA)
there is also a slope of RAM crawling up... little spikes are overhead when backups are ongoing.
I started to reboot XOA+all 4 proxxies every morning.
-
@Pilow We pushed a lot of memory fixes to master, would it be possible to test it ?
-
@florent said in backup mail report says INTERRUPTED but it's not ?:
@Pilow We pushed a lot of memory fixes to master, would it be possible to test it ?
how so ? I stop my reboot everyday task and check if RAM is still crawling to 8Gb ?
-
memory problems arise on our XOA
we have a spare XO CE deployed by ronivay script on ubuntu VM that we use only as a spare when main XOA is upgrading/rebooting
same pools/hosts attached, quite a read only XOtotally different behavior

-
@Pilow Which Node JS version does your XO CE instance use?
Could you possibly also check what Node JS version your XOA uses?
As discussed in this thread maybe there are some RAM management differences when comparing XO on different Node JS versions.
I would also be a big fan of Vates recommending (in documentation) XO CE users to use the exact same Node JS version as XOA uses... I feel like that would streamline things. Otherwise it feels like us XO CE users are "beta testers".
//EDIT: @pilow also maybe the totally different RAM usage seen in your screenshots might be related to the XO CE not doing any backup jobs? You mentioned that you use XO CE purely as a read-only fallback instance. During my personal tests it looked like the RAM hogging is related to backup jobs and RAM is not being freed after backups finished.
-
@john.c said in backup mail report says INTERRUPTED but it's not ?:
Are you using NodeJS 22 or 24 for your instance of XO?
here is the node version on our problematic XOA
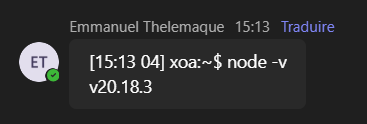
this XOA do NOT manage backup jobs, totally offloaded to XO PROXIESXOA PROXies :
[06:18 04] xoa@XOA-PROXY01:~$ node -v
v20.18.3
and XO CE :
root@fallback-XOA:~# node -v v24.13.0 -
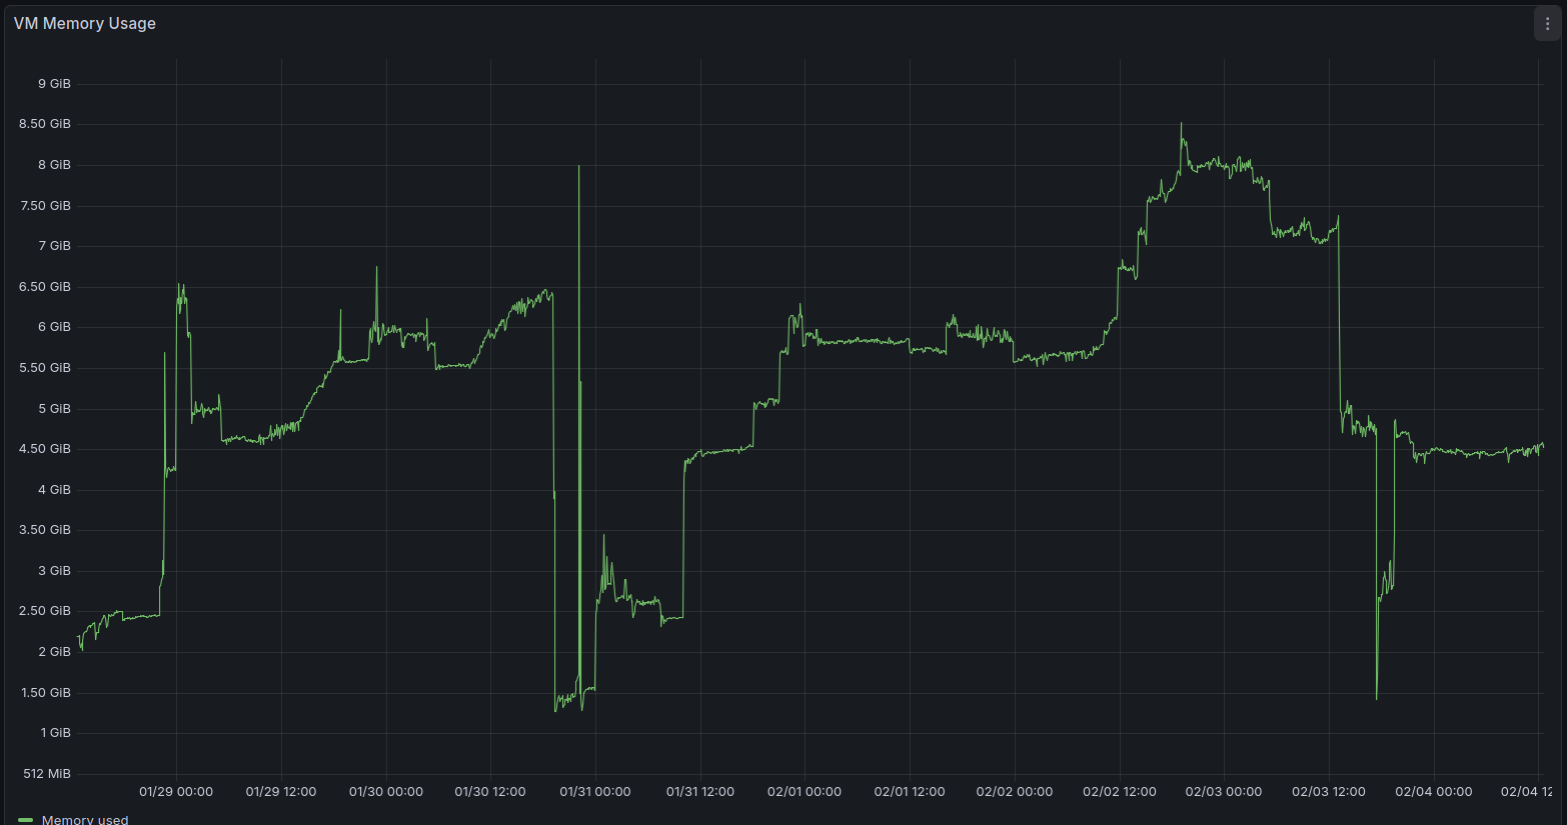
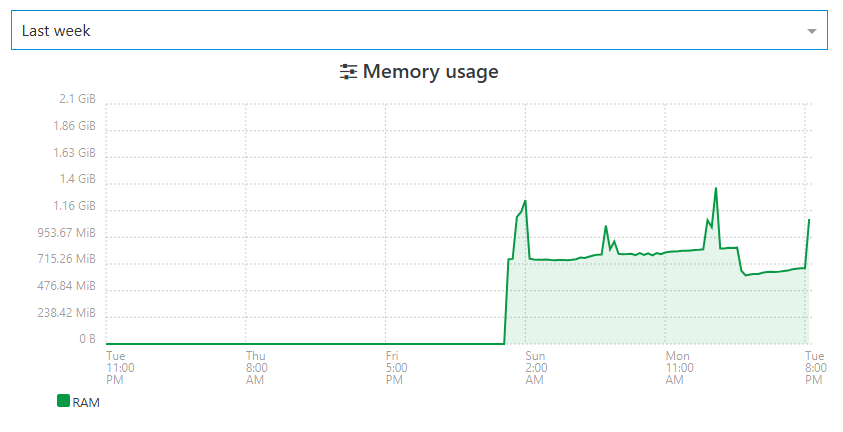
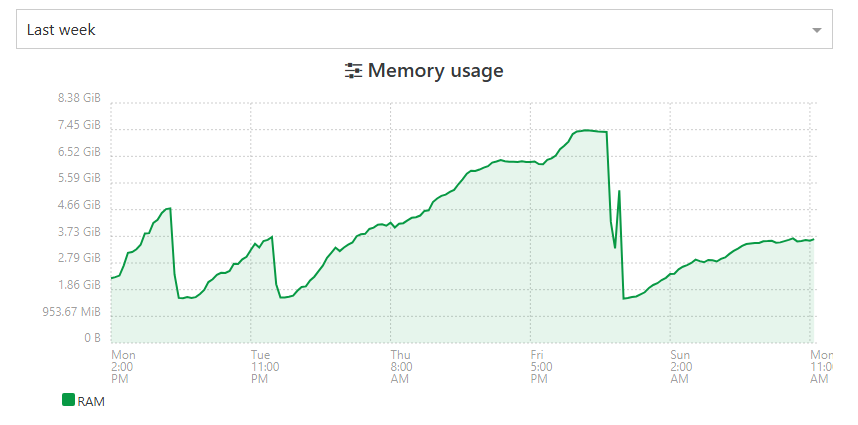
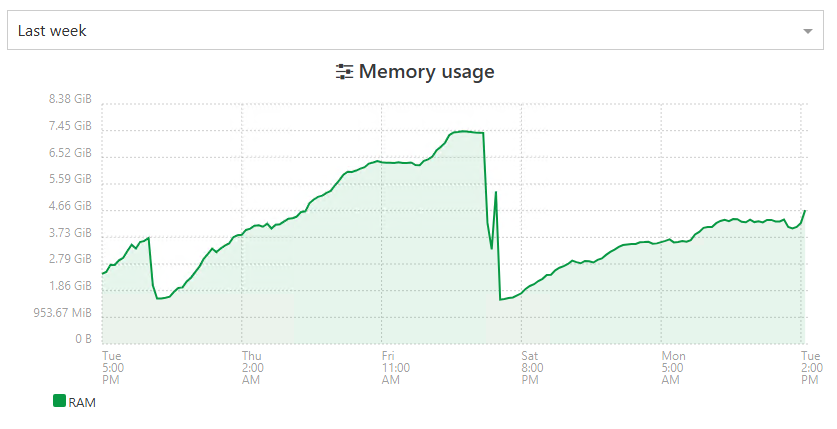
This is the RAM usage of my XO CE instance (Debian 13, Node 24, XO commit fa110ed9c92acf03447f5ee3f309ef6861a4a0d4 / "feat: release 6.1.0")
Metrics are exported via XO openmetrics plugin.
At the spots in the graph where my XO CE instance used around 2GB of RAM it was freshly restarted.
Between 31.01. and 03.02. you can see the RAM usage climbing and climbing until my backup jobs went into "interrupted" status on 03.02. due to Node JS heap issue as described in my error report in post https://xcp-ng.org/forum/post/102160. -
I deployed XOA and used it to create a list of all XO dependencies and their respective versions as this seems to be the baseline that Vates tests against.
I then went ahead and re-deployed my XO CE VM using the exact same package versions that XOA uses.
This resulted in me using Debian 12, kernel 6.1, Node 20, etc.
I hope that this gives my backup jobs more stability.
It would be convenient if we would be able to get this information (validated, stable dependencies) from documentation instead of having to deploy XOA.
Best regards
-
That's precisely the value of XOA and why we are selling it. If you want best tested/stability, XOA is the way to go
")
-
@olivierlambert Sure, I absolutely get that XO CE comes with absolutely no warranty and XOA is the supported, enterprise grade product.
If the budget was there and if I was to decide on that I would be happy to use it.It might still be a good idea to update your documentation at https://docs.xen-orchestra.com/installation#packages-and-prerequisites to at least align it with the Node JS version that you actually use and test against internally.
(The linked part of documentation advises to use Node 24 while you are shipping Node 20 in XOA.)During testing it looked like running XO on Node 20 behaves quite differently compared to running it on Node 24 when it comes to RAM management. It looks like this got also confirmed by other users in this thread.
XO CE users actually using and testing the versions that you ship might be of value for finding bugs.
I think the documentation should generally advise to use the packages that you target during development in order to make the experience as good as possible for everyone.Just my two cents.
-
Yes, we'll update the doc
-
so, I stopped rebooting my XOA everyday
just patched 6.1.1, it restarted xo-server
guess I'll have to let it disabled for 48h to see if with new patch, RAM is still ramping up.
will report back. -
ramp up and stabilization at 2.9Gb RAMneed some 48H more data to confirm the behavior have changed
XOPROXIES have also been upgraded to latests :
they didnt present any problem of RAM overusage even before
and my 4 proxies are offloading the entire backup jobs from main XOA thats serves only for management -
@Pilow that is a good news
-
@florent
checked this morning, it took another step to 3.63Gb used RAM.the slope is really different than before, stay tuned
-
i'm not foreseeing something good happening on this one
still growing

Hello! It looks like you're interested in this conversation, but you don't have an account yet.
Getting fed up of having to scroll through the same posts each visit? When you register for an account, you'll always come back to exactly where you were before, and choose to be notified of new replies (either via email, or push notification). You'll also be able to save bookmarks and upvote posts to show your appreciation to other community members.
With your input, this post could be even better 💗
Register Login