@dhiraj26683 We have production related infrastructure setup on these Hosts. Access to the services hosted gets a little slower than usual. For e.g among other services, one of the service is our deployent server, which we use to deploy softwares from a repository hosted on that server itself. We could see the delays in operations, even if the deployment servers utilization is not that high. If we move the server to another hosts, whose utilization is low, the service works well.
We need to restart the XCP host and everything works well like before. So at the end, we have only one solution to restart the impacted XCP hosts, when this memory utilization reach it's limit and alerts being started about it.
Latest posts made by dhiraj26683
-
RE: Memory Consumption goes higher day by day
-
RE: Memory Consumption goes higher day by day
@dhiraj26683 I know xcp-ng center is not supported anymore. But whenever this happens, inspite of lot of memory in cache, the VM's performance gets impacted.
-
RE: Memory Consumption goes higher day by day
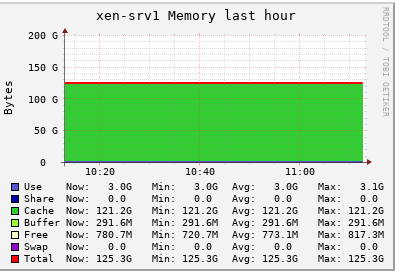
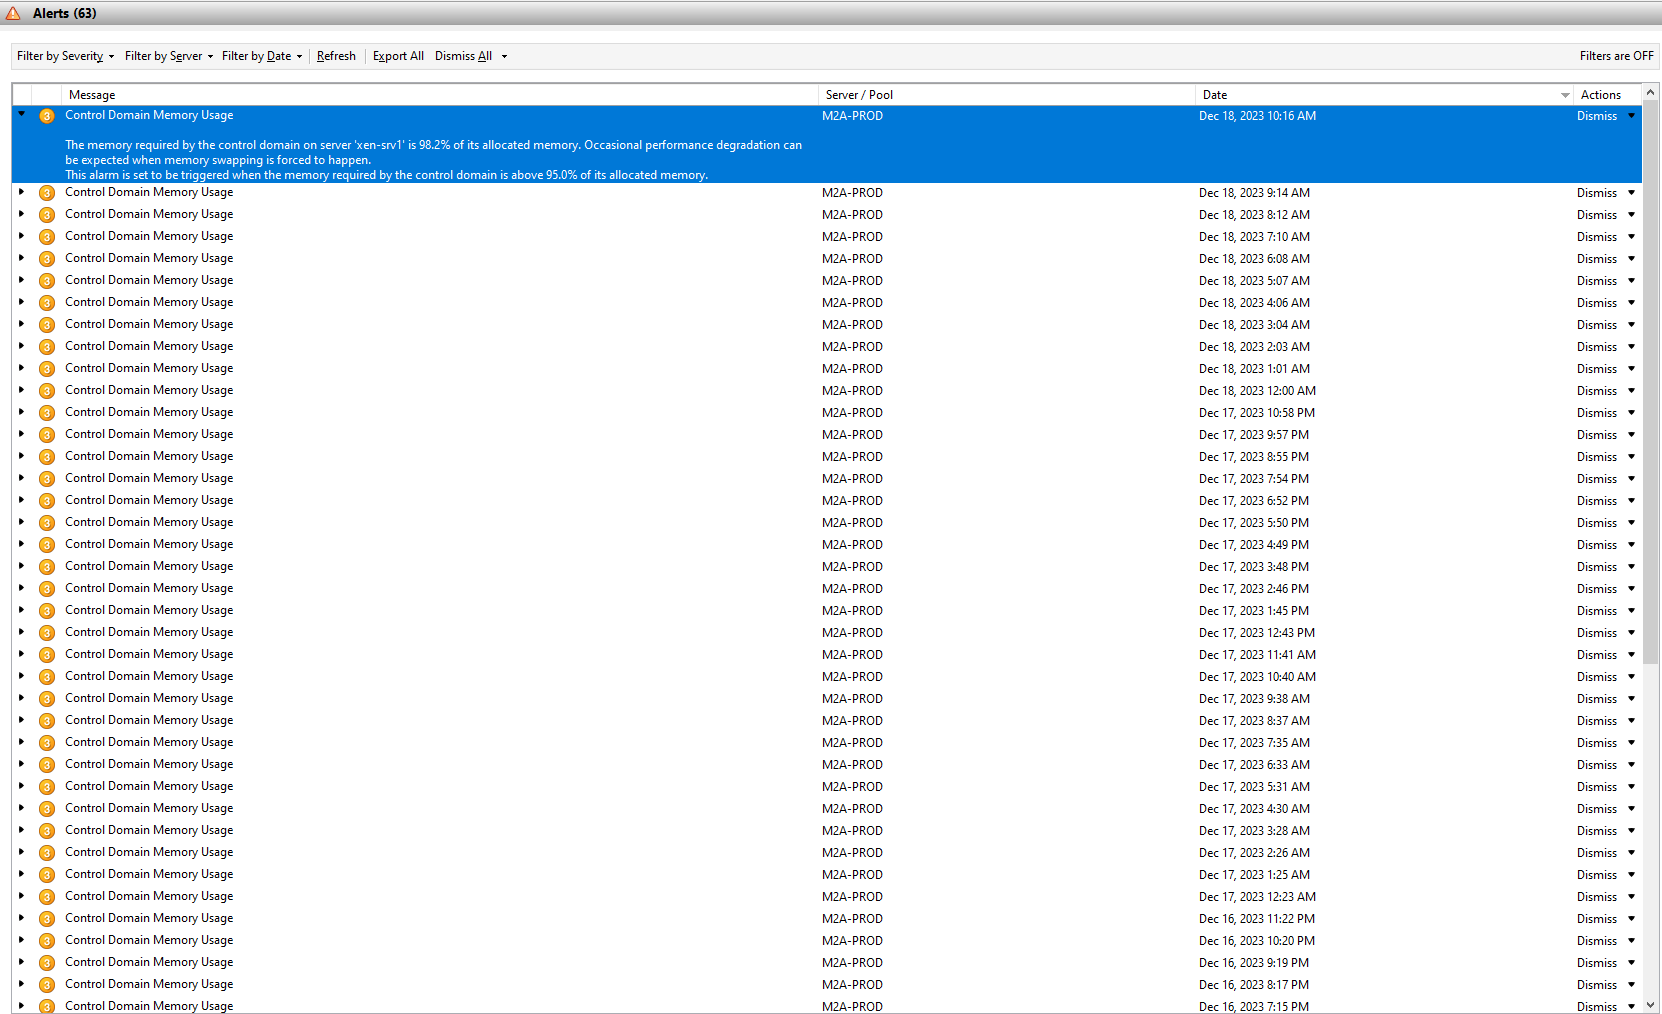
@dhiraj26683 Here we go. Memory accumulated in cache and XCP-NG console started to say about 98% of allocated memory got use, performance degradation might happen.
-
RE: Memory Consumption goes higher day by day
@dhiraj26683 Ahh yes, we are using ha-lizard in our two node cluster. Thanks for pointing that out @tuxen. But the thing is, we are using it since 4-5 years and it's with basic configuration. I don't thing that we are using TGT iSCSI drivers or enabled any kind of write-cache. If that's the case then, we would have seen same behaviour in all the nodes we have in same pool and other pools.
We have configured below parameters only related to ha-lizard and that's since we start using it, no change in between.
DISABLED_VAPPS=() DISK_MONITOR=1 ENABLE_ALERTS=1 ENABLE_LOGGING=1 FENCE_ACTION=stop FENCE_ENABLED=1 FENCE_FILE_LOC=/etc/ha-lizard/fence FENCE_HA_ONFAIL=0 FENCE_HEURISTICS_IPS=10.66.0.1 FENCE_HOST_FORGET=0 FENCE_IPADDRESS= FENCE_METHOD=POOL FENCE_MIN_HOSTS=2 FENCE_PASSWD= FENCE_QUORUM_REQUIRED=1 FENCE_REBOOT_LONE_HOST=0 FENCE_USE_IP_HEURISTICS=1 GLOBAL_VM_HA=0 HOST_SELECT_METHOD=0 MAIL_FROM=xen-cluster1@xxx.xx MAIL_ON=1 MAIL_SUBJECT="SYSTEM_ALERT-FROM_HOST:$HOSTNAME" MAIL_TO=it@xxxxx.xxx MGT_LINK_LOSS_TOLERANCE=5 MONITOR_DELAY=15 MONITOR_KILLALL=1 MONITOR_MAX_STARTS=20 MONITOR_SCANRATE=10 OP_MODE=2 PROMOTE_SLAVE=1 SLAVE_HA=1 SLAVE_VM_STAT=0 SMTP_PASS="" SMTP_PORT="25" SMTP_SERVER=10.66.1.241 SMTP_USER="" XAPI_COUNT=2 XAPI_DELAY=10 XC_FIELD_NAME='ha-lizard-enabled' XE_TIMEOUT=10@yann @stormi @olivierlambert we have updated the ixgbe driver on one of the node a day back. Lets see. I will update asap hold on commenting on this thread unless we hit a issue again. Thank you so much for your help guys.
-
RE: Memory Consumption goes higher day by day
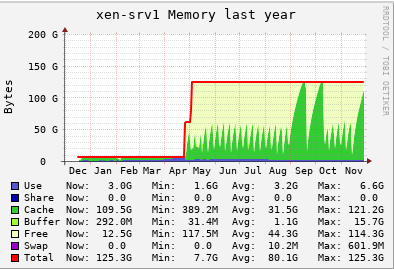
@yann @stormi We have used vGPU for about 8-9 months. Initially we never faced any issue. When we were about to stop the vGPU workflow, it started and even after stoping that workflow, it is. We need to restart the servers to release the memory. We use to migrate all VM's to one server and restart individual host. And this issue started resently, before we never faced such thing.
Providing below is a year graph of both servers.
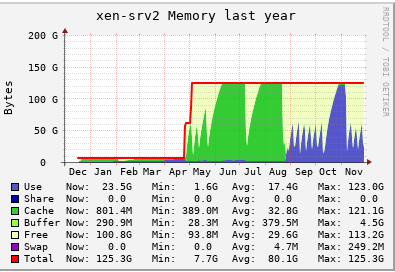
But i will surely try the new drivers and see if that helps. Thanks for your inputs guys. Much appreciated.
-
RE: Memory Consumption goes higher day by day
@yann I can understand the buff/cache part but on this server which is with 1TB physical memory and only three VM's running with 8G, 32G and 64G as their alloted memory, eating up and alloting all memory in cache is not understandable. It's getting cache means something is using it. Not sure if that makes sence though.
Initially both our XCP hosts were with 16G Control domain memory. We started to face issue and alerts, we increased to 32G, then 64G, and then 128G, and it's like that for a while now.
Now we are not using vGPU, so it's not getting full within 2 days where alerts starts saying Control domain memory reached it's limit
-
RE: Memory Consumption goes higher day by day
@stormi Sure, we can try that. Thank you
-
RE: Memory Consumption goes higher day by day
-
RE: Memory Consumption goes higher day by day
@olivierlambert i believe it's something related to nic drivers as we are running network intensive guests on both the servers.
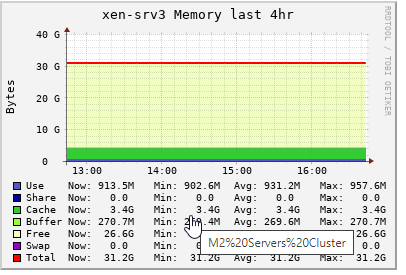
We have a third Server, which is runing standalone. Below is it's config and only one guests runs on this host, which is XOA
CPU - AMD Tyzen Threadripper PRO 3975WX 32-Cores 3500 MHz
Memory - 320G
Ethernet - 1G Ethernet
10G Fiber

intel-ixgbe-5.9.4-1.xcpng8.2.x86_64As XOA does uses 10G ethernet for backup/migration operations. It seems to be caching not that much memory, but it is caching though. But not ending up utilizing all memory in cache because less operations happens here.
