Memory Consumption goes higher day by day
-
@dhiraj26683 Thanks for replying back @olivierlambert
Nothing as such other than Ice drivers.But for now, we are not running any virtual GPU workstation from last 3-4 months, so that kind of load is not there on any of our XCP hosts.
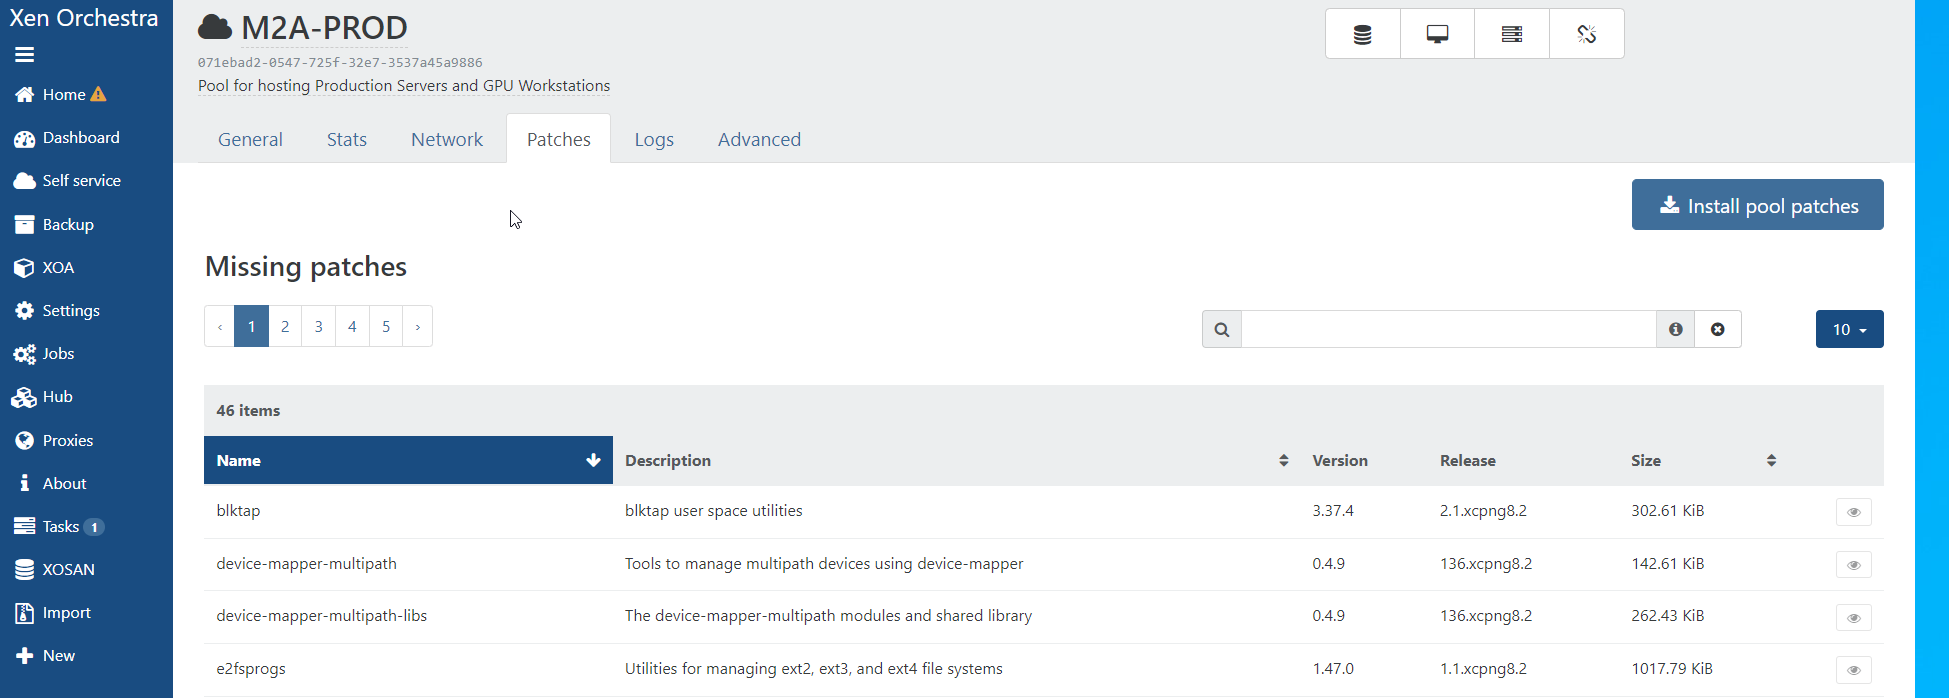
But as i could say, this memory issue started resently and and the only changes that we do is to push the patches via xoa.
Considering this kind of issue, where memory gets fullly utilized (get into cache) and notifications start about Control Domain Load reached 100%, we didn't pushed any patches for now.
-
Let me ping @psafont in case he got an idea on what could cause this
edit: also @gduperrey if he got an idea how to see what's eating all the memory
-
@dhiraj26683 the cached memory is not used by any particular process, it is used to keep eg. recently-accessed in memory to avoid reading them again from disk if the need arises. The OS is trying to make good use of otherwise-unused memory in hope of better performance, instead of letting unused memory just sitting idle.
If you launch a new process that would require more memory than what's currently free, the OS should happily free old cached pages for immediate reuse.
Did you observe anything specifically wrong, that turned you to observing memory consumption?
-
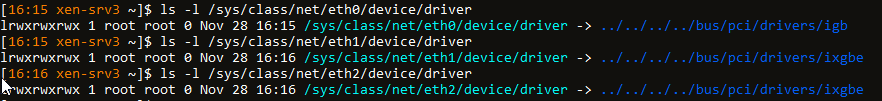
@olivierlambert i believe it's something related to nic drivers as we are running network intensive guests on both the servers.
We have a third Server, which is runing standalone. Below is it's config and only one guests runs on this host, which is XOA
CPU - AMD Tyzen Threadripper PRO 3975WX 32-Cores 3500 MHz
Memory - 320G
Ethernet - 1G Ethernet
10G Fiber
intel-ixgbe-5.9.4-1.xcpng8.2.x86_64As XOA does uses 10G ethernet for backup/migration operations. It seems to be caching not that much memory, but it is caching though. But not ending up utilizing all memory in cache because less operations happens here.
-
@yann Hello @yann I am well aware about the caching. But the question is which process is utilizing that memory which gets accumulated into cache and ends up reaching 120G
-
@dhiraj26683 Would you like to try a newer
ixgbe? We've got 5.18.6 available in our repositories. -
@dhiraj26683 if it was used by a process it would be counted in
usednot inbuff/cache. Those are used by the kernel's Virtual Filesystem subsystem.Now if your problem is that a given process fails to allocate memory while there is so much of the memory in buff/cache, then there may be something to dig in that direction, but we'll need specific symptoms to be able to help.
-
@stormi Sure, we can try that. Thank you
-
@dhiraj26683 It's available as the
intel-ixgbe-altRPM, that you can install withyum install.However, I second Yann's comment: growing cache usage is not an issue, as long as it's reclaimed when another process needs more than what's available, and this is what should happen whenever such a need arises. Unless you have evidence of actual issues caused by this cache usage.
-
@yann I can understand the buff/cache part but on this server which is with 1TB physical memory and only three VM's running with 8G, 32G and 64G as their alloted memory, eating up and alloting all memory in cache is not understandable. It's getting cache means something is using it. Not sure if that makes sence though.
Initially both our XCP hosts were with 16G Control domain memory. We started to face issue and alerts, we increased to 32G, then 64G, and then 128G, and it's like that for a while now.
Now we are not using vGPU, so it's not getting full within 2 days where alerts starts saying Control domain memory reached it's limit
-
-
@dhiraj26683 Could you detail these alerts and what they are based on? A linux system with most memory allocated to cache is exactly what is expected, after a few hours, days or weeks of use. On my computer, right now, I only use 6 GB out of 16 GB, but 9 GB are used by cache and buffers, and only 1 GB is free. However, I don't have any performance issues because, should I open a demanding process, cache will be reclaimed. Cache is just free memory which happens to contain stuff that might be useful again before it is thrown away due to more prioritary uses of memory.
-
I think he's talking about XAPI alerts, done via the message object (see https://xapi-project.github.io/xen-api/classes/message.html). That's what we display in XO in the Dashboard/Health view (we call them "Alerts")
-
@dhiraj26683 let me try to rephrase - I hear 2 things:
- "buff/cache" has to come from somewhere: right. Pages used as read cache ought to be traceable to data read from a disk, and some (intrusive) monitoring could be put in place to find out what data and who pulls them into RAM. But checking this would only make sense if you can observe the cached memory not being released when another process allocates memory. Also note in "buff/cache" we don't only have read cache (
Cachefrom/proc/meminfo) but also write buffers (Buffersinmeminfo) - you had memory issues when you used vGPU, and now you don't (or you still have but less?): this could look like a memory leak in the vGPU driver?
- "buff/cache" has to come from somewhere: right. Pages used as read cache ought to be traceable to data read from a disk, and some (intrusive) monitoring could be put in place to find out what data and who pulls them into RAM. But checking this would only make sense if you can observe the cached memory not being released when another process allocates memory. Also note in "buff/cache" we don't only have read cache (
-
@yann @stormi We have used vGPU for about 8-9 months. Initially we never faced any issue. When we were about to stop the vGPU workflow, it started and even after stoping that workflow, it is. We need to restart the servers to release the memory. We use to migrate all VM's to one server and restart individual host. And this issue started resently, before we never faced such thing.
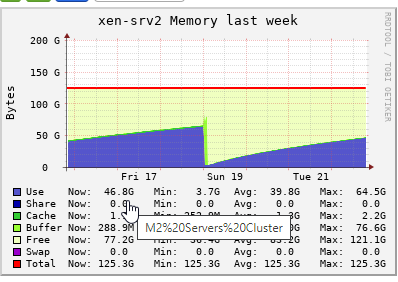
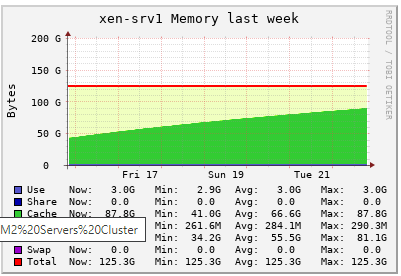
Providing below is a year graph of both servers.
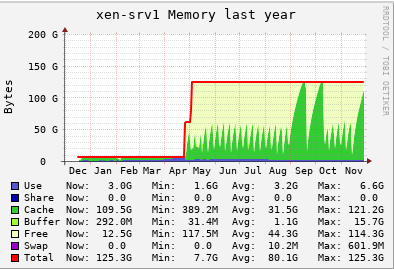
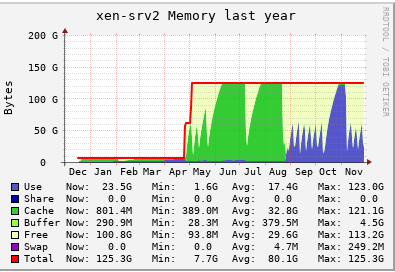
But i will surely try the new drivers and see if that helps. Thanks for your inputs guys. Much appreciated.
-
@dhiraj26683 seeing the htop output, there's some HA-LIZARD PIDs running. So, yes, there's "extra stuff" installed on dom0
")
HA-LIZARD uses the TGT iSCSI driver which in turn has an implicit
write-cacheoption enabled by default, if not set [1][2]. Is this option disabled in/etc/tgt/targets.conf?
[1] https://www.halizard.com/ha-iscsi
[2] https://manpages.debian.org/testing/tgt/targets.conf.5.en.html -
@dhiraj26683 Ahh yes, we are using ha-lizard in our two node cluster. Thanks for pointing that out @tuxen. But the thing is, we are using it since 4-5 years and it's with basic configuration. I don't thing that we are using TGT iSCSI drivers or enabled any kind of write-cache. If that's the case then, we would have seen same behaviour in all the nodes we have in same pool and other pools.
We have configured below parameters only related to ha-lizard and that's since we start using it, no change in between.
DISABLED_VAPPS=() DISK_MONITOR=1 ENABLE_ALERTS=1 ENABLE_LOGGING=1 FENCE_ACTION=stop FENCE_ENABLED=1 FENCE_FILE_LOC=/etc/ha-lizard/fence FENCE_HA_ONFAIL=0 FENCE_HEURISTICS_IPS=10.66.0.1 FENCE_HOST_FORGET=0 FENCE_IPADDRESS= FENCE_METHOD=POOL FENCE_MIN_HOSTS=2 FENCE_PASSWD= FENCE_QUORUM_REQUIRED=1 FENCE_REBOOT_LONE_HOST=0 FENCE_USE_IP_HEURISTICS=1 GLOBAL_VM_HA=0 HOST_SELECT_METHOD=0 MAIL_FROM=xen-cluster1@xxx.xx MAIL_ON=1 MAIL_SUBJECT="SYSTEM_ALERT-FROM_HOST:$HOSTNAME" MAIL_TO=it@xxxxx.xxx MGT_LINK_LOSS_TOLERANCE=5 MONITOR_DELAY=15 MONITOR_KILLALL=1 MONITOR_MAX_STARTS=20 MONITOR_SCANRATE=10 OP_MODE=2 PROMOTE_SLAVE=1 SLAVE_HA=1 SLAVE_VM_STAT=0 SMTP_PASS="" SMTP_PORT="25" SMTP_SERVER=10.66.1.241 SMTP_USER="" XAPI_COUNT=2 XAPI_DELAY=10 XC_FIELD_NAME='ha-lizard-enabled' XE_TIMEOUT=10@yann @stormi @olivierlambert we have updated the ixgbe driver on one of the node a day back. Lets see. I will update asap hold on commenting on this thread unless we hit a issue again. Thank you so much for your help guys.
-
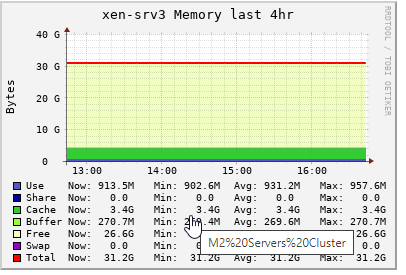
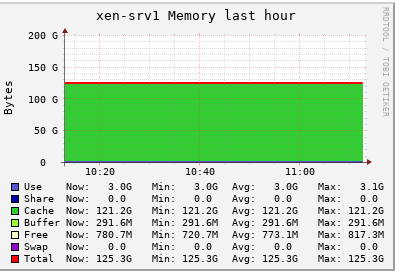
@dhiraj26683 Here we go. Memory accumulated in cache and XCP-NG console started to say about 98% of allocated memory got use, performance degradation might happen.
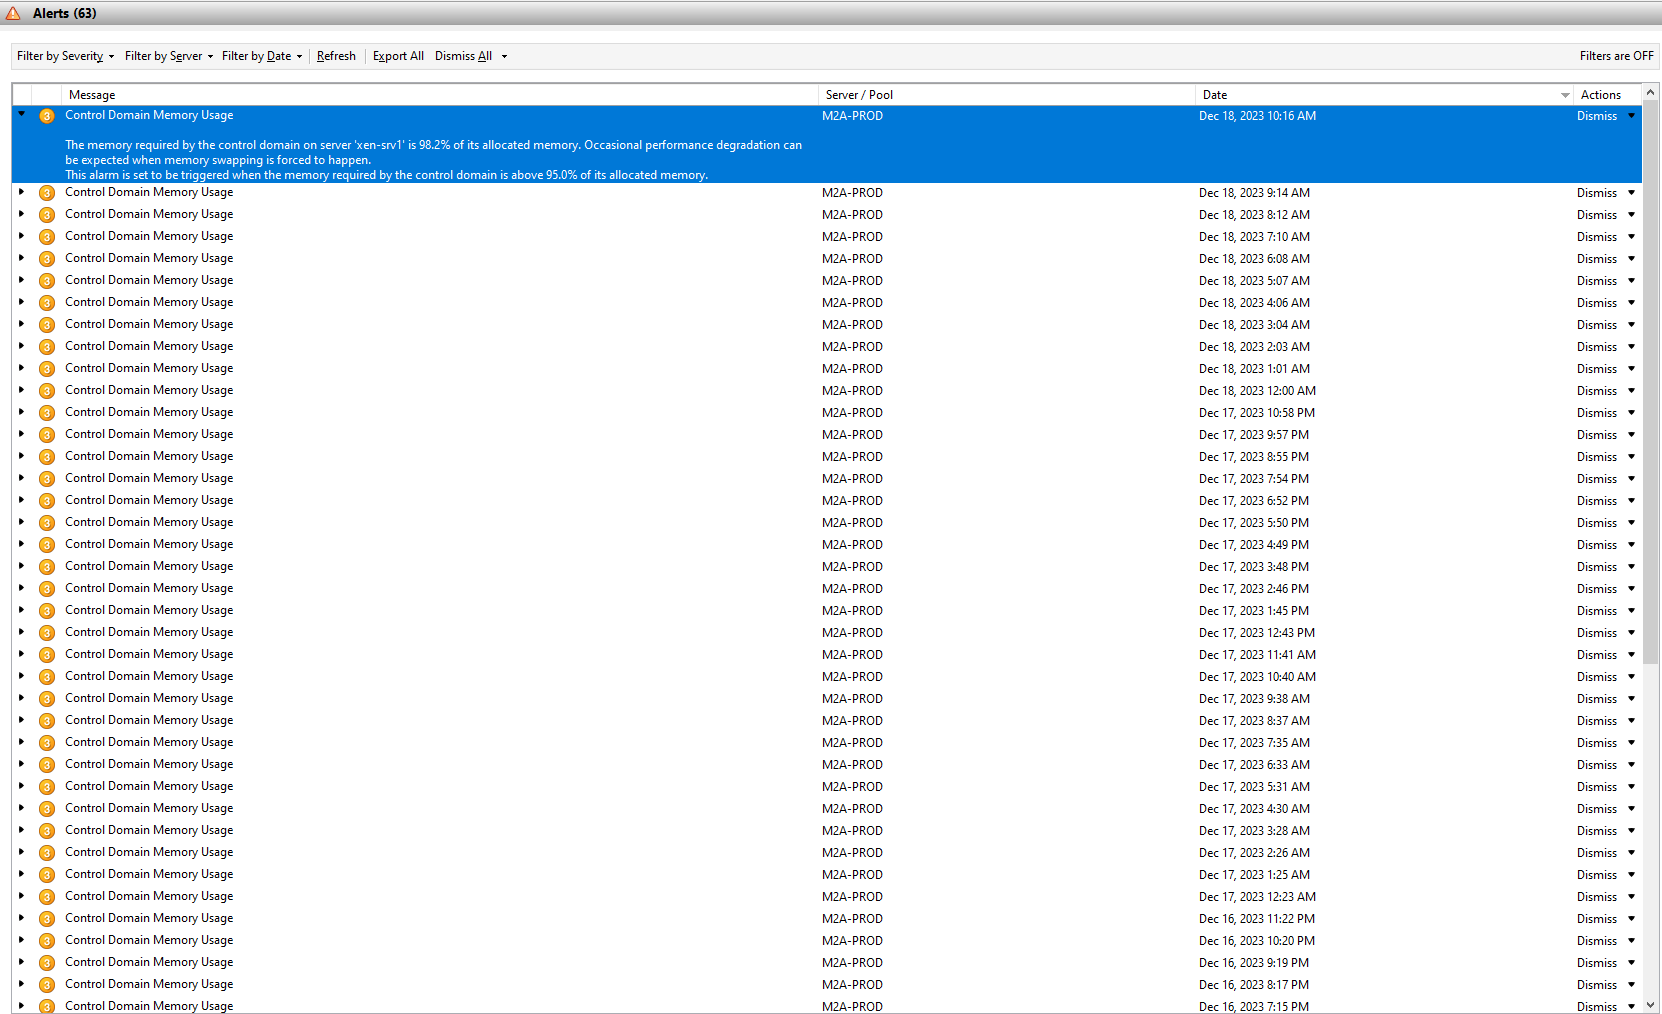
-
@dhiraj26683 I know xcp-ng center is not supported anymore. But whenever this happens, inspite of lot of memory in cache, the VM's performance gets impacted.
-
@dhiraj26683 How do you see VM performance is impacted?
Hello! It looks like you're interested in this conversation, but you don't have an account yet.
Getting fed up of having to scroll through the same posts each visit? When you register for an account, you'll always come back to exactly where you were before, and choose to be notified of new replies (either via email, or push notification). You'll also be able to save bookmarks and upvote posts to show your appreciation to other community members.
With your input, this post could be even better 💗
Register Login