Hey everyone,
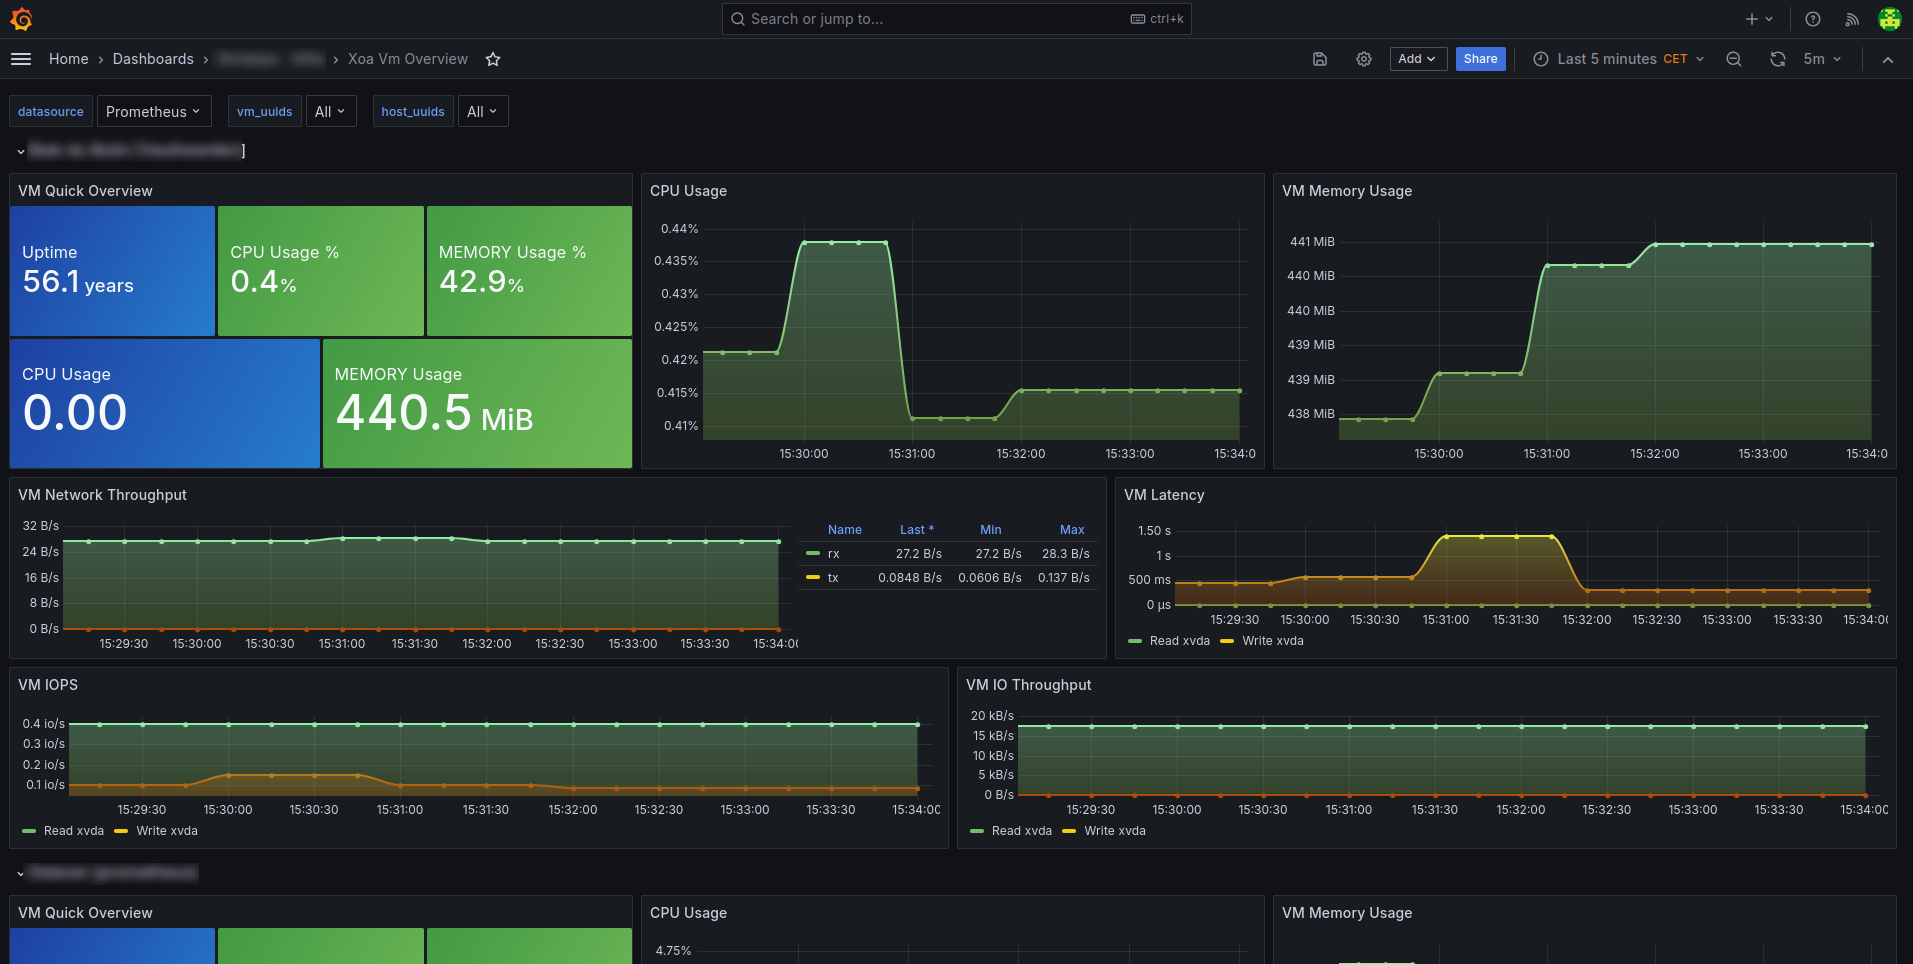
I'm creating this topic to showcase what's possible with the new Openmetrics data exports in Xen Orchestra using Prometheus and Grafana to build dashboards and monitoring tools.
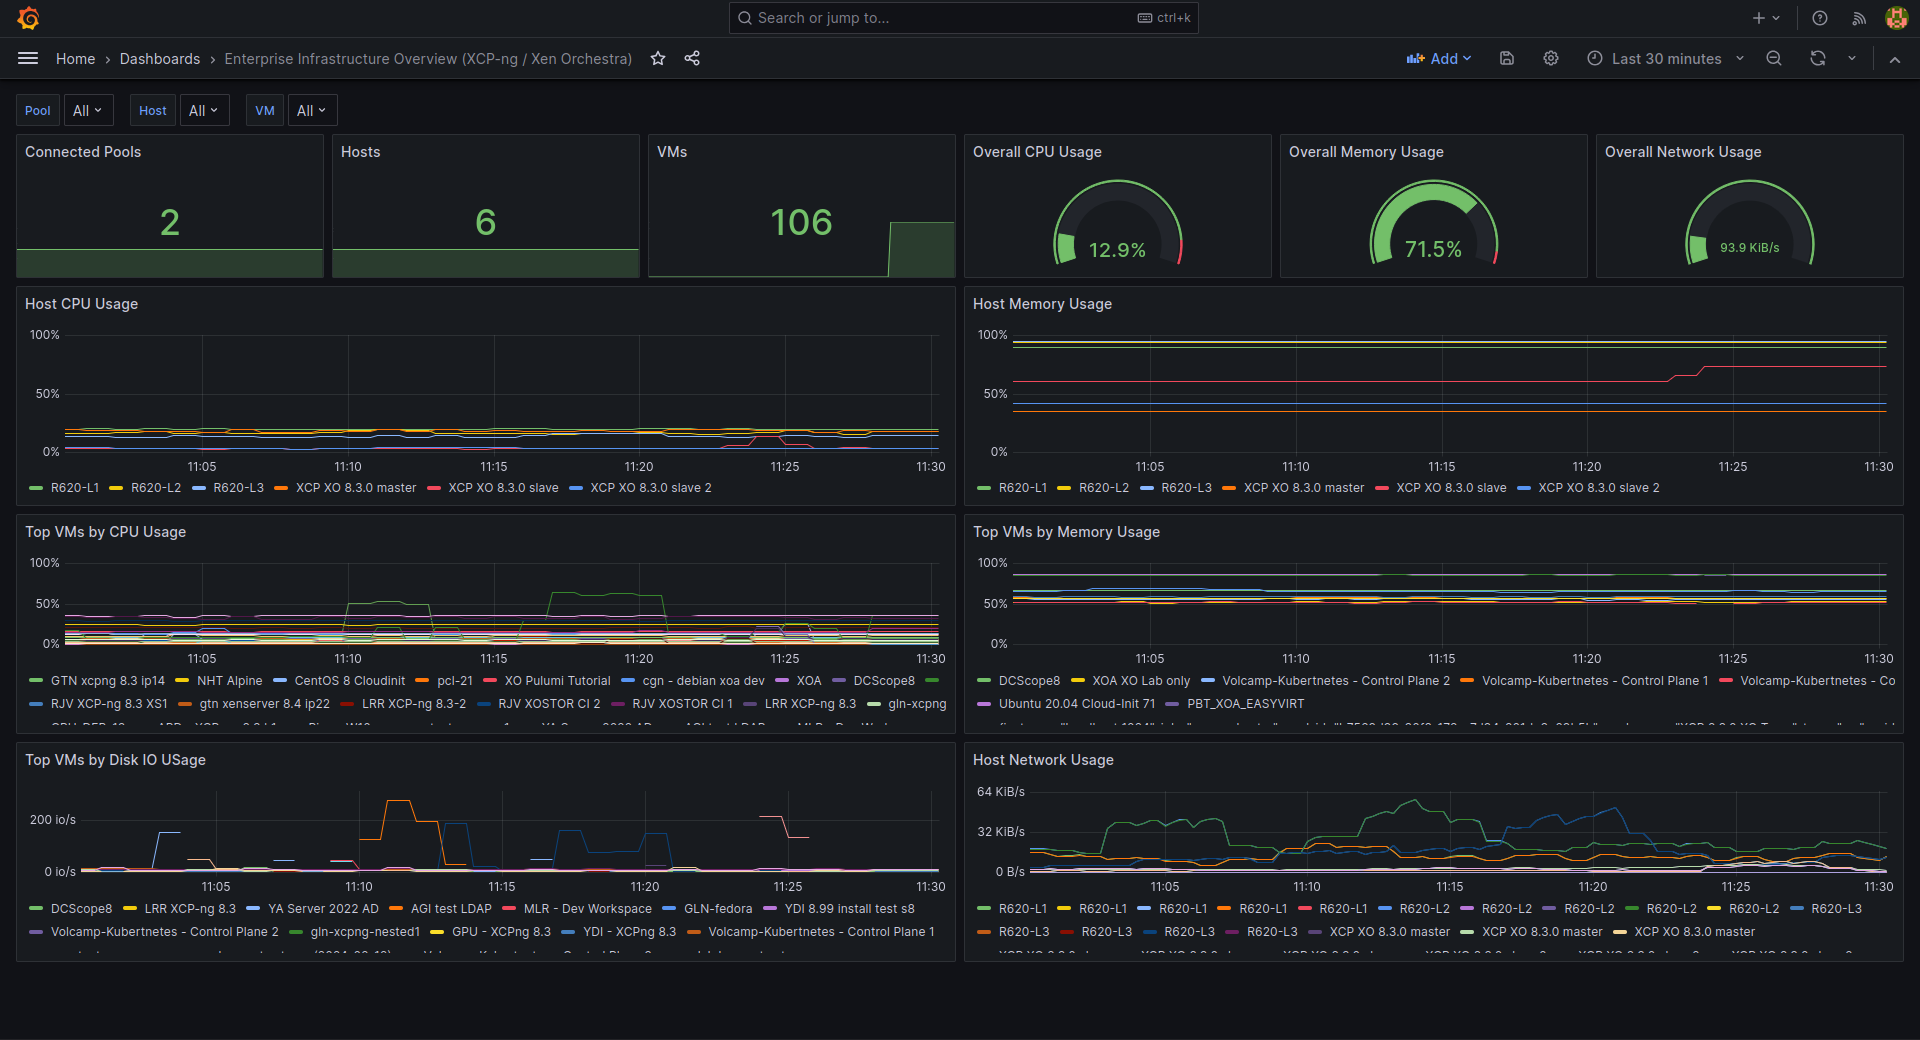
Here is the json used for this demo dashboard: JSON
All the available metrics are described in https://docs.xen-orchestra.com/advanced
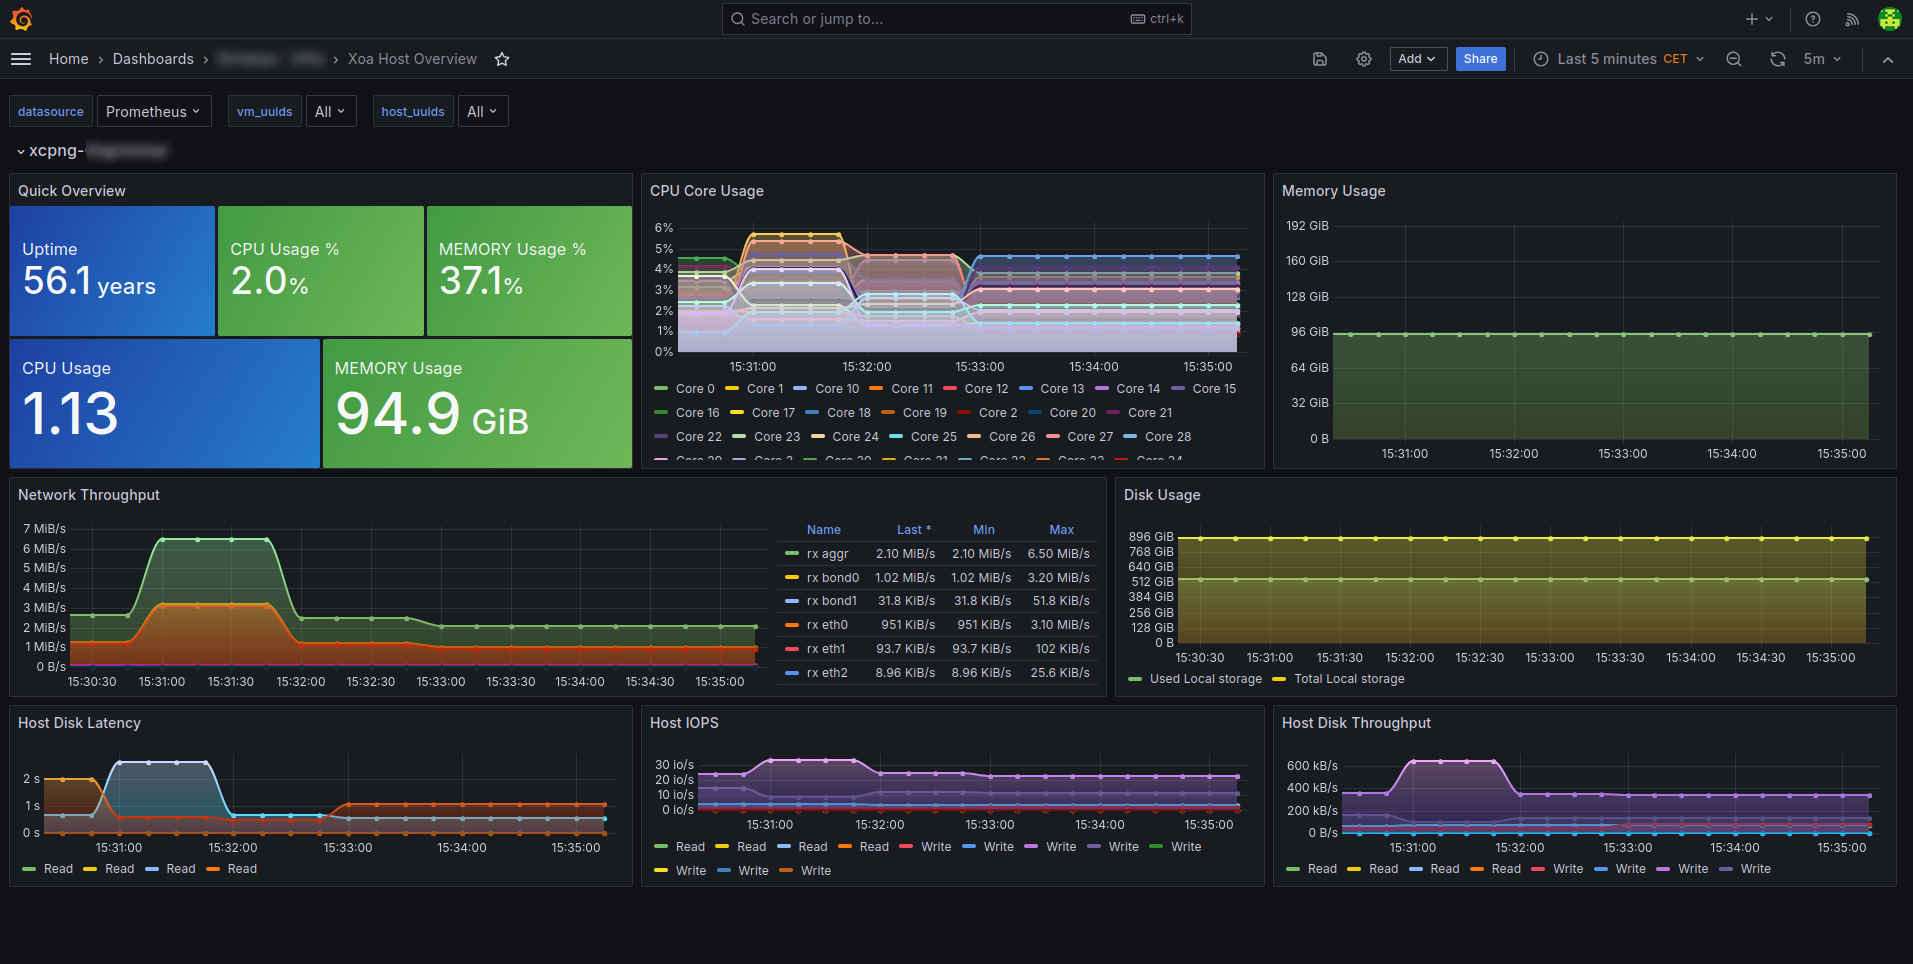
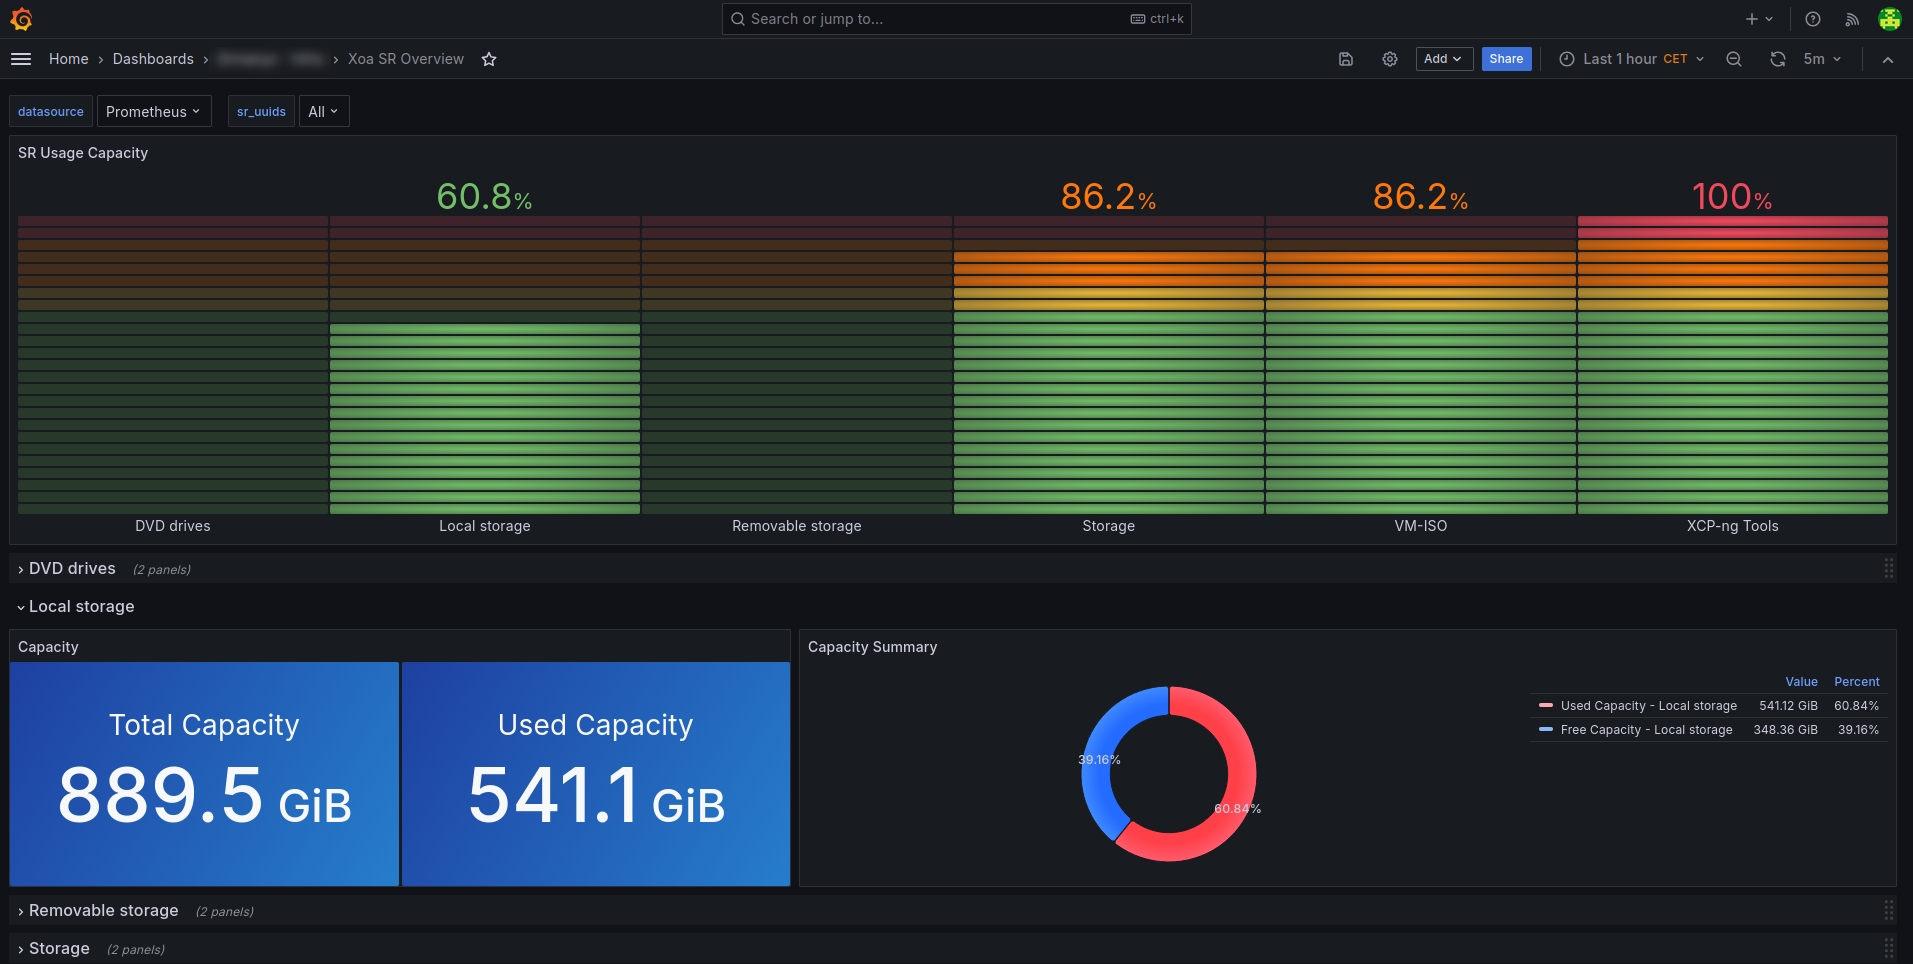
Here are a few other examples and JSONs from our community:
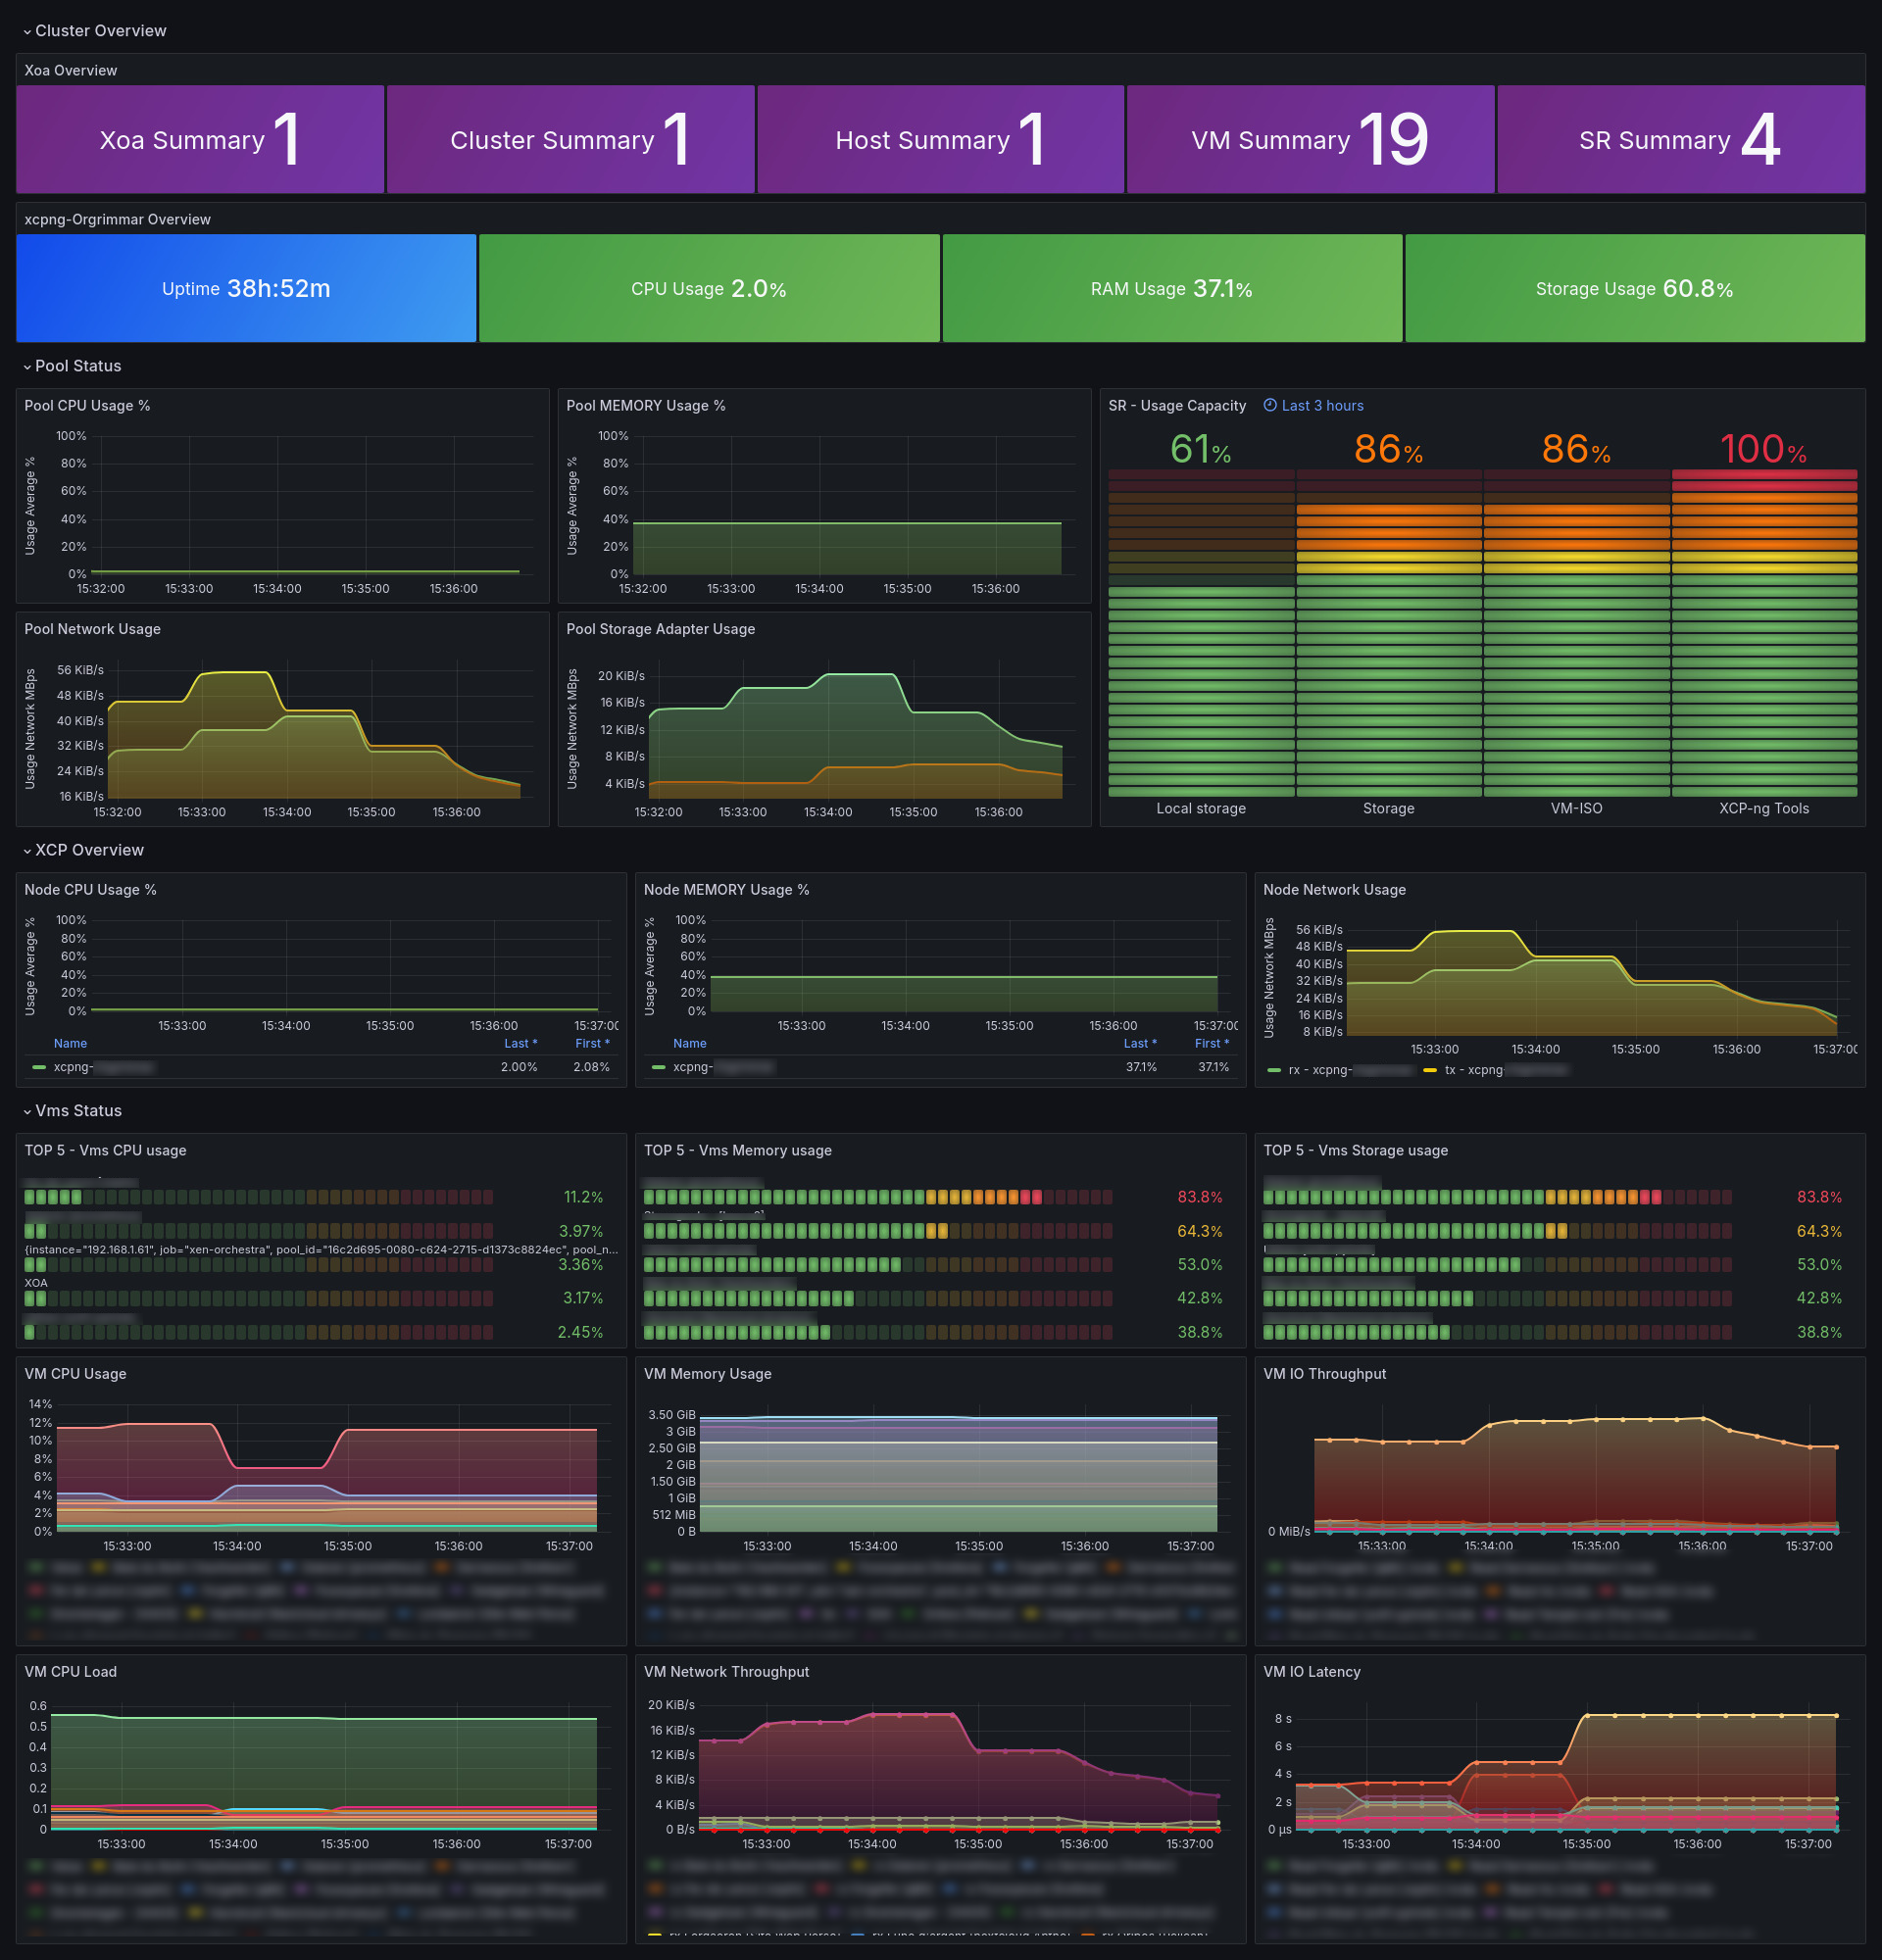
Xoa Cluster Overview
Xoa Host Overview
Xoa SR Overview
Xoa Vm Overview
Don't hesitate to showcase your dashboards here, share your config files or suggest new metrics !
")