XCP-ng
    • Categories
    • Recent
    • Tags
    • Popular
    • Users
    • Groups
    • Register
    • Login

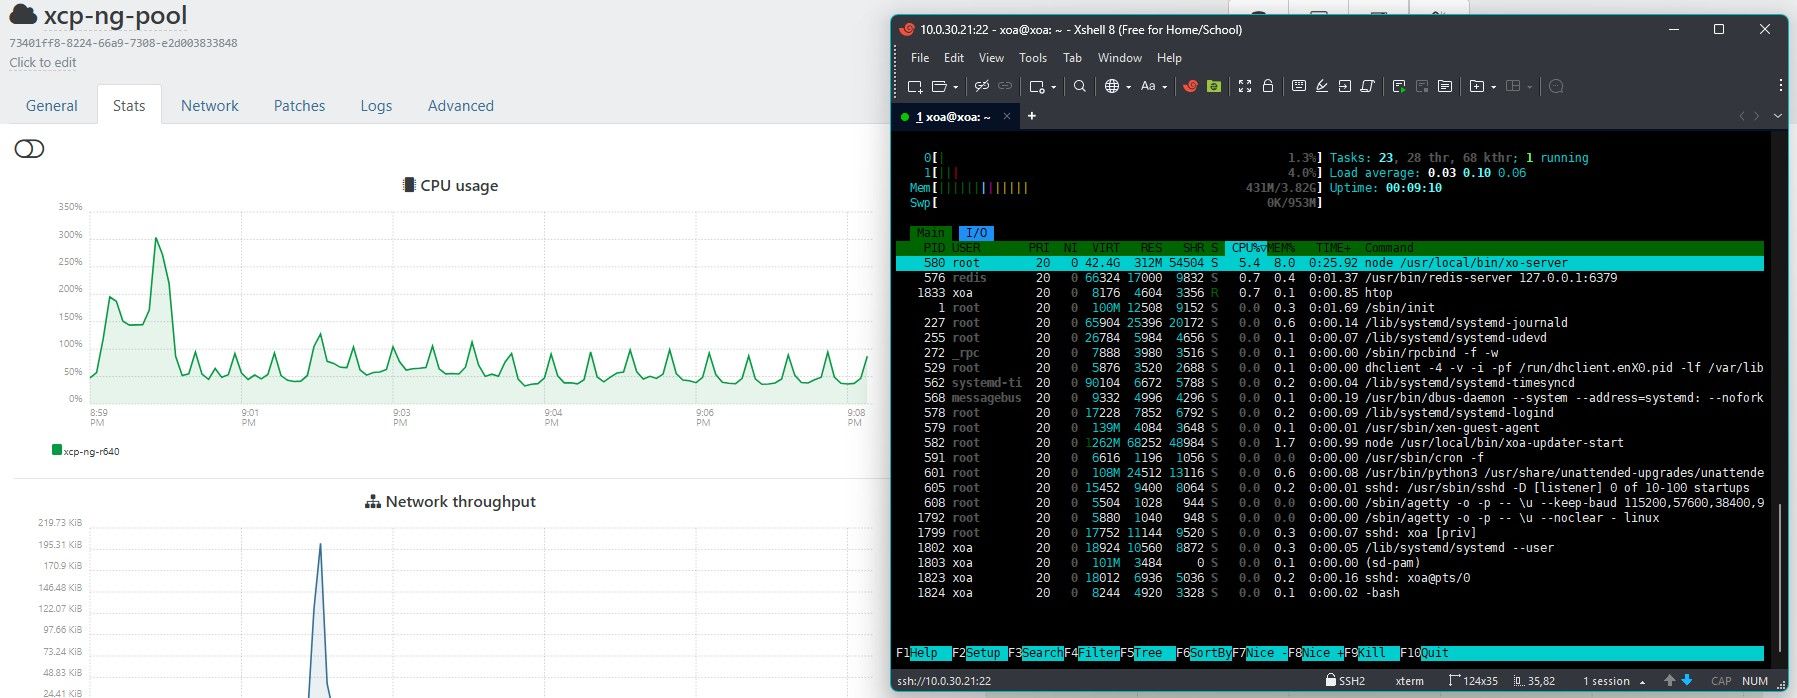
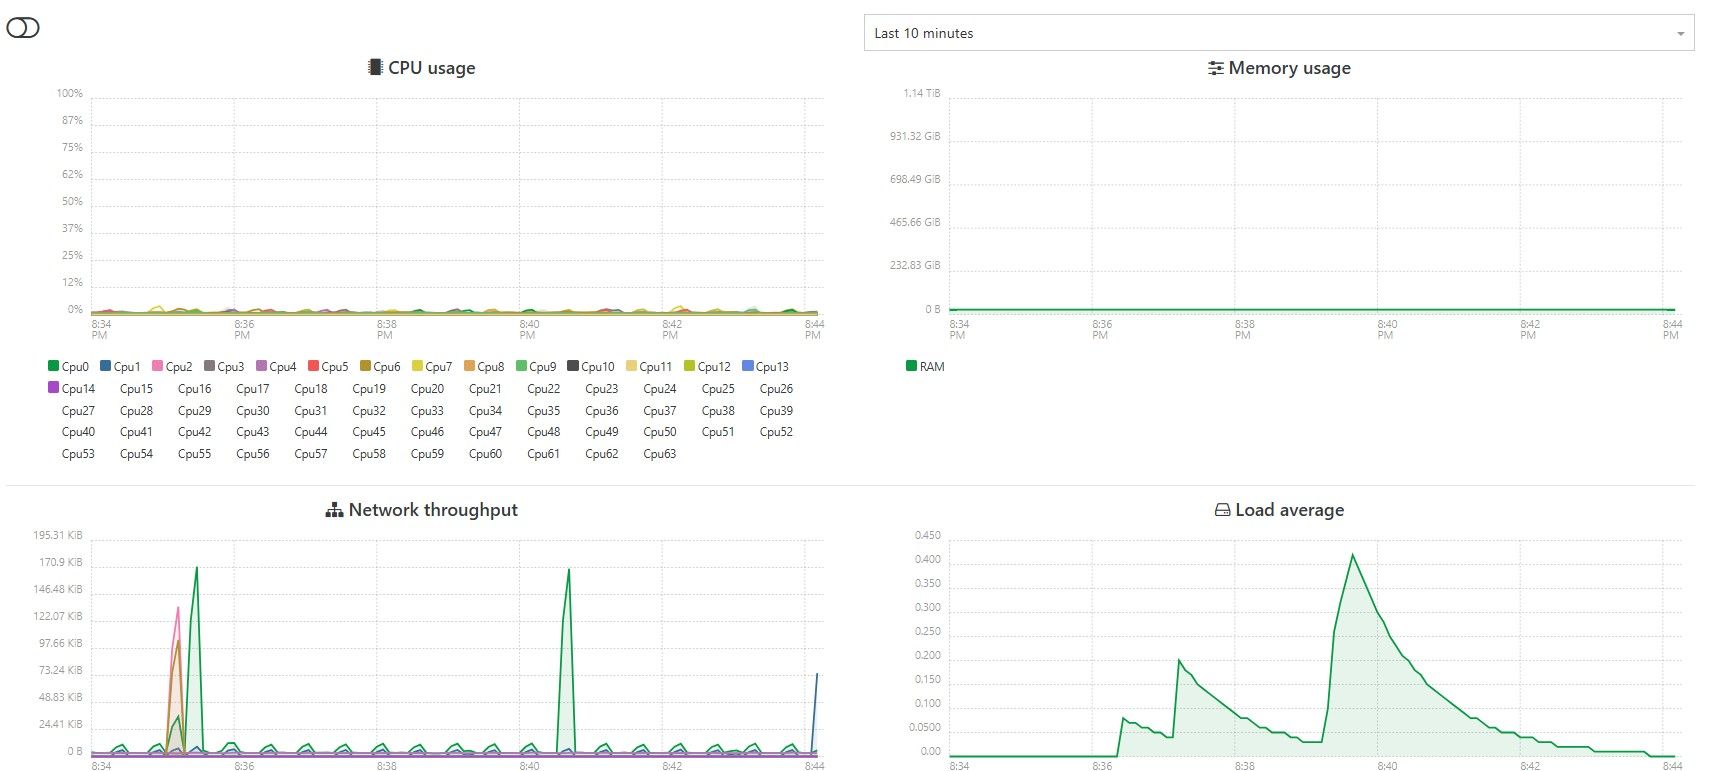
    CPU Usage of empty server

    Scheduled Pinned Locked Moved XCP-ng
    14 Posts 2 Posters 107 Views 2 Watching
    Loading More Posts
    • Oldest to Newest
    • Newest to Oldest
    • Most Votes
    Reply
    • Reply as topic
    Log in to reply
    This topic has been deleted. Only users with topic management privileges can see it.
    • jerry1333J Offline
      jerry1333
      last edited by

      XOA htop looks like this:
      ff4865df-0387-4ea6-85b6-29ab928911d2-image.jpeg

      Video from xoa and xo:
      https://imgur.com/a/SUyppQr

      P 1 Reply Last reply Reply Quote 0
      • P Online
        Pilow @jerry1333
        last edited by

        @jerry1333 nothing obvious.. except for NETDATA popping on your host
        7a0648b8-058a-4b28-8a8e-b7f0b47fff75-image.jpeg

        did you enable advanced telemetry ? could be it

        jerry1333J 1 Reply Last reply Reply Quote 0
        • jerry1333J Offline
          jerry1333 @Pilow
          last edited by

          @Pilow Yes, it was enabled, then cpu usage shown on pool was around 50%.
          When I disable plugin then it gets back to ~30%.

          Is there a way to remove netdata from host?

          Anyway I will wipe this server and try new install with custom xoa (self compiled) and keep watching how it will behave.

          P 1 Reply Last reply Reply Quote 0
          • P Online
            Pilow @jerry1333
            last edited by

            @jerry1333 you could try to stop & disable auto load plugin in SETTING/PLUGINS
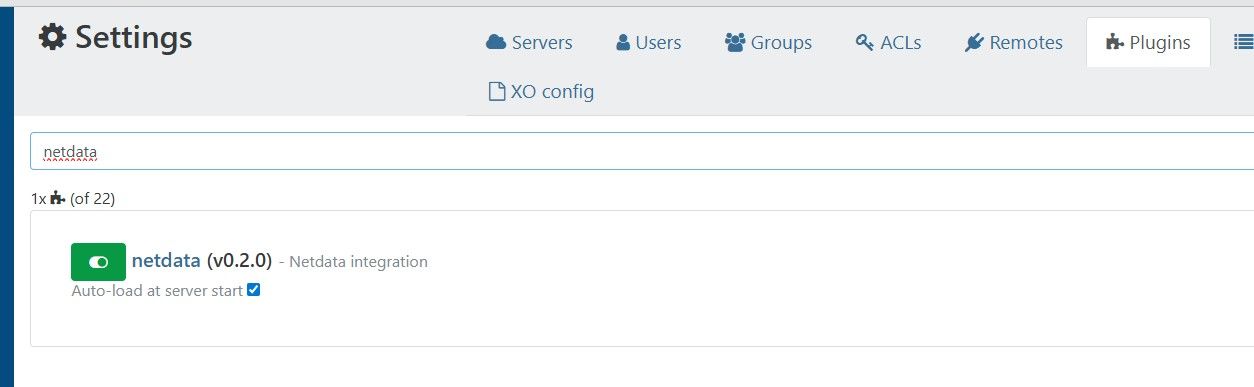
            7398f8dd-4dd1-49de-9ab2-727a804310b4-image.jpeg

            and restart host ?

            jerry1333J 1 Reply Last reply Reply Quote 0
            • jerry1333J Offline
              jerry1333 @Pilow
              last edited by

              @Pilow did that but netdata on host is still working :
              c61dcf2f-2337-4c69-83ae-a8f657947412-image.jpeg

              jerry1333J P 2 Replies Last reply Reply Quote 0
              • jerry1333J Offline
                jerry1333 @jerry1333
                last edited by

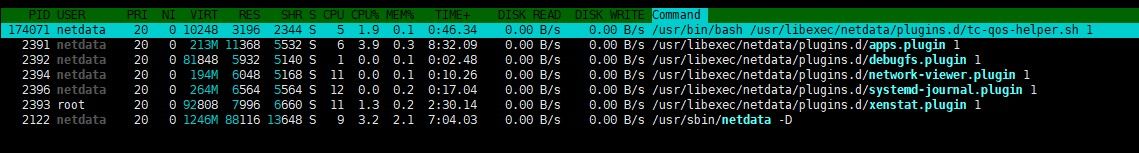
                If I kill netdata process it will come back by it self.

                1 Reply Last reply Reply Quote 0
                • P Online
                  Pilow @jerry1333
                  last edited by

                  @jerry1333 on your host

                  # systemctl status netdata
                  ● netdata.service - Real time performance monitoring
                     Loaded: loaded (/usr/lib/systemd/system/netdata.service; enabled; vendor preset: disabled)
                     Active: active (running) since Sun 2026-02-01 13:55:32 +04; 2 months 4 days ago
                    Process: 2425 ExecStartPre=/usr/libexec/netdata/xcpng-iptables-restore.sh (code=exited, status=0/SUCCESS)
                   Main PID: 2464 (netdata)
                     Memory: 355.1M
                     CGroup: /system.slice/netdata.service
                             ├─   2464 /usr/sbin/netdata -D
                             ├─   2466 spawn-plugins
                             ├─   2724 /usr/libexec/netdata/plugins.d/network-viewer.plugin 1
                             ├─   2739 /usr/libexec/netdata/plugins.d/apps.plugin 1
                             ├─   2743 /usr/libexec/netdata/plugins.d/systemd-journal.plugin 1
                             ├─   2745 spawn-setns
                             ├─2300997 /usr/libexec/netdata/plugins.d/debugfs.plugin 1
                             └─3392346 /usr/bin/bash /usr/libexec/netdata/plugins.d/tc-qos-helper.sh 1


                  try that :

                  systemctl stop netdata
                  
                  P 1 Reply Last reply Reply Quote 1
                  • P Online
                    Pilow @Pilow
                    last edited by

                    followed by a

                    systemctl disable netdata
                    

                    it should get rid of it, no easy way by XOA UI to disable this

                    jerry1333J 1 Reply Last reply Reply Quote 1
                    • jerry1333J Offline
                      jerry1333 @Pilow
                      last edited by

                      @Pilow After disabling netdata service cpu usage droped by 10% on both host and pool.
                      1a9e7823-c5c7-4d22-ba3d-113e1aa85816-image.jpeg
                      3d65987c-16ca-4dc3-b83f-6906c5564fa0-image.jpeg

                      Step in right direction, thanks 🙂

                      I was expecting empty server cpu usage on 2-5% level but maybe xcp behaves like this and it is normal?

                      P 1 Reply Last reply Reply Quote 0
                      • P Online
                        Pilow @jerry1333
                        last edited by

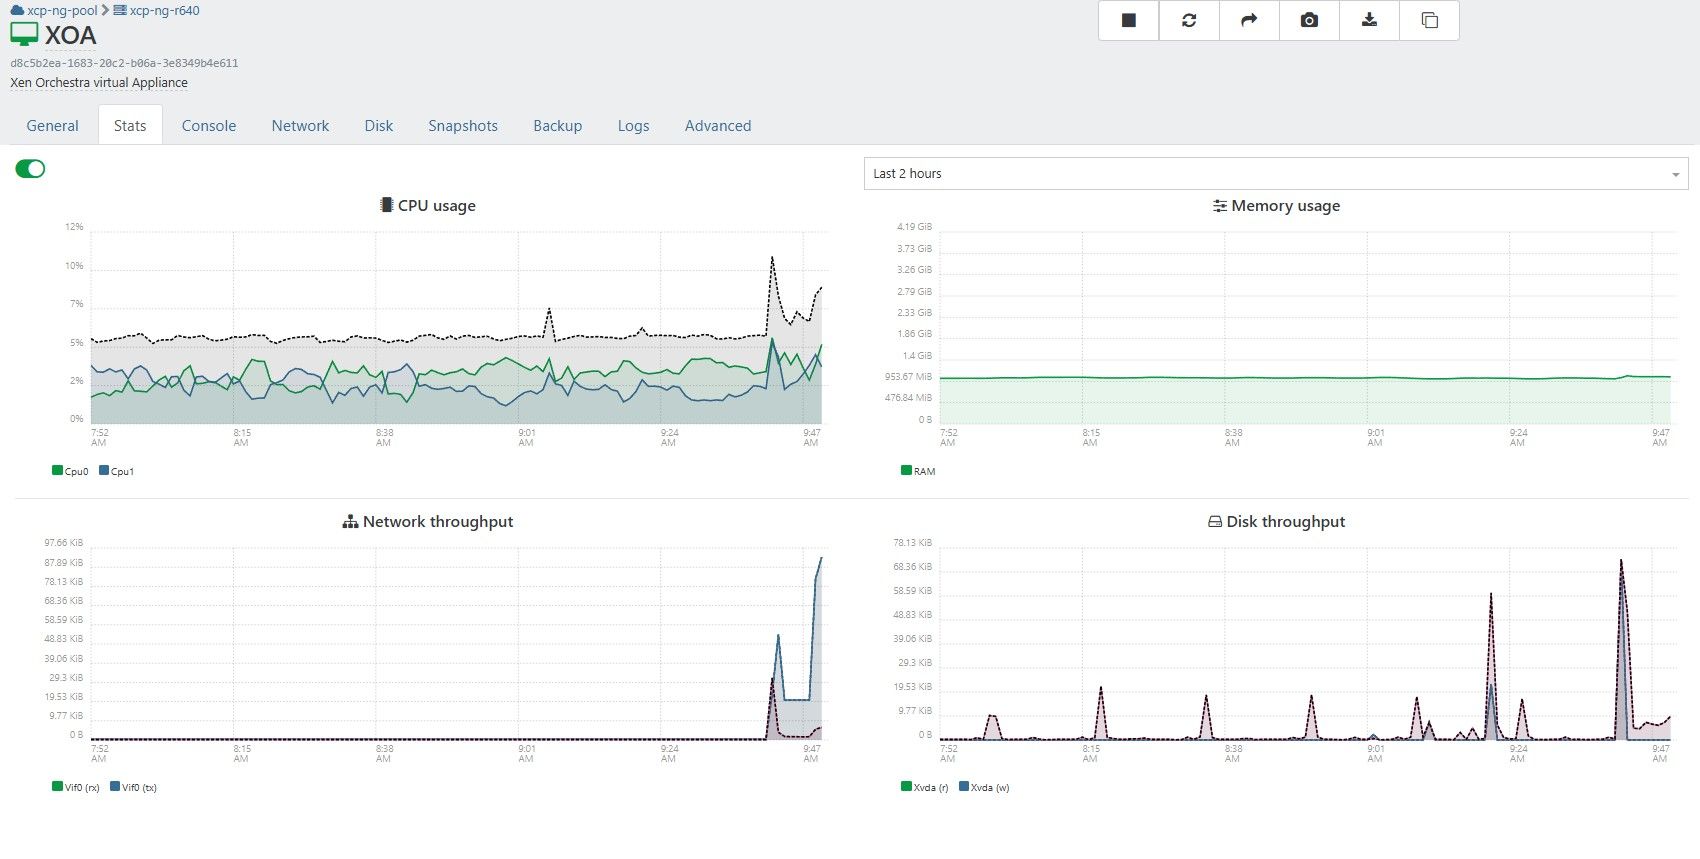
                        @jerry1333 I have an empty server in a pool, I do see some regulare bumps in the network, probably XOA polling RRDs for the stats from the master.

                        but no spikes in CPU as you have
                        b953cca1-d4fc-4457-a542-67680ddec4f9-image.jpeg

                        P 1 Reply Last reply Reply Quote 0
                        • P Online
                          Pilow @Pilow
                          last edited by

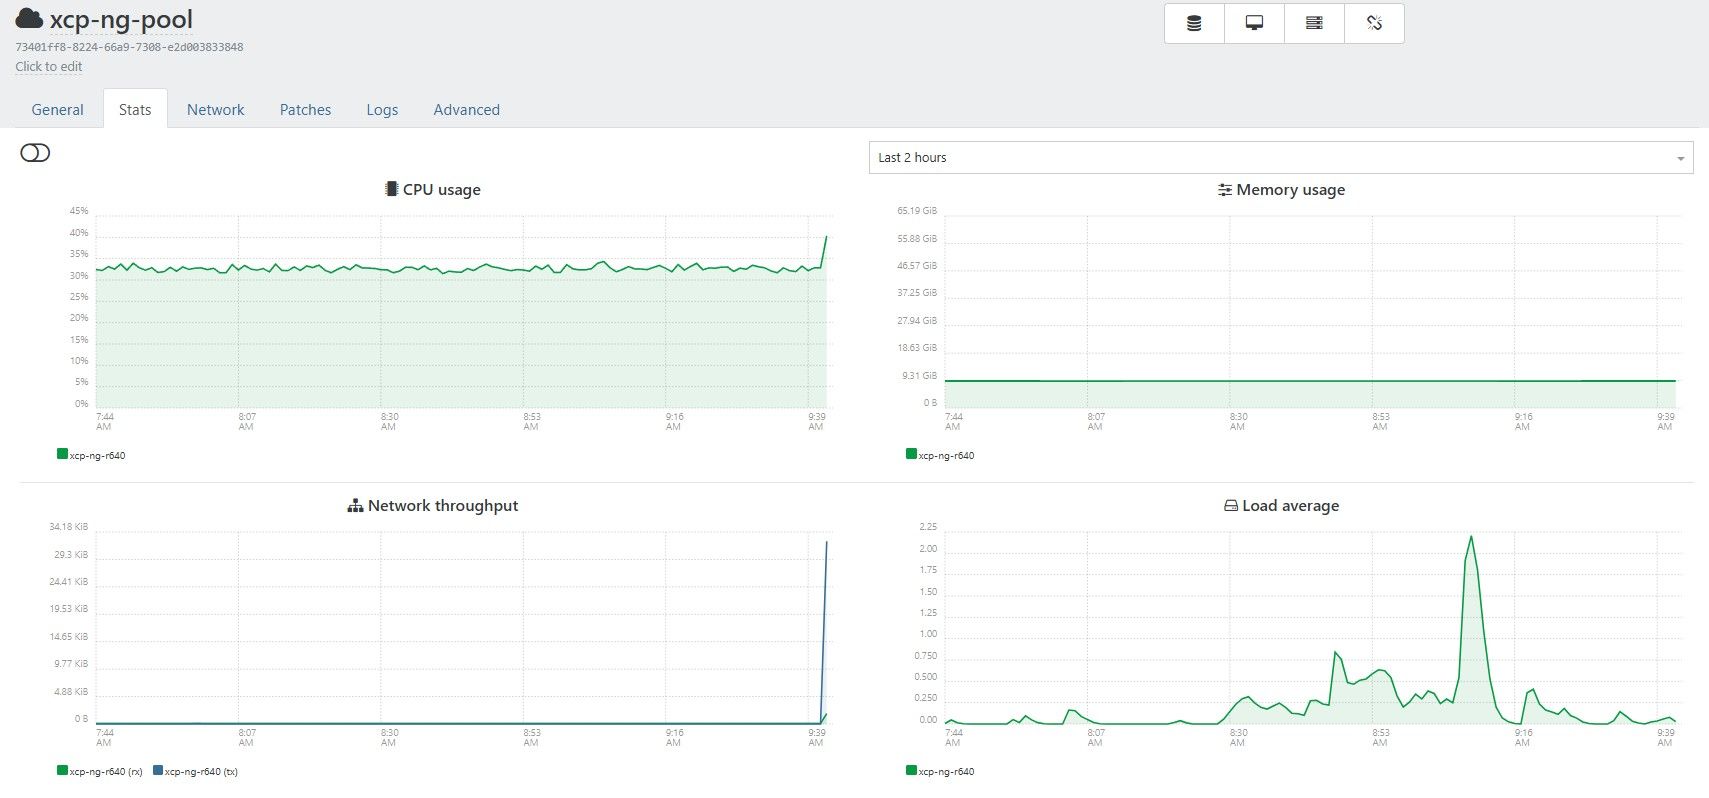
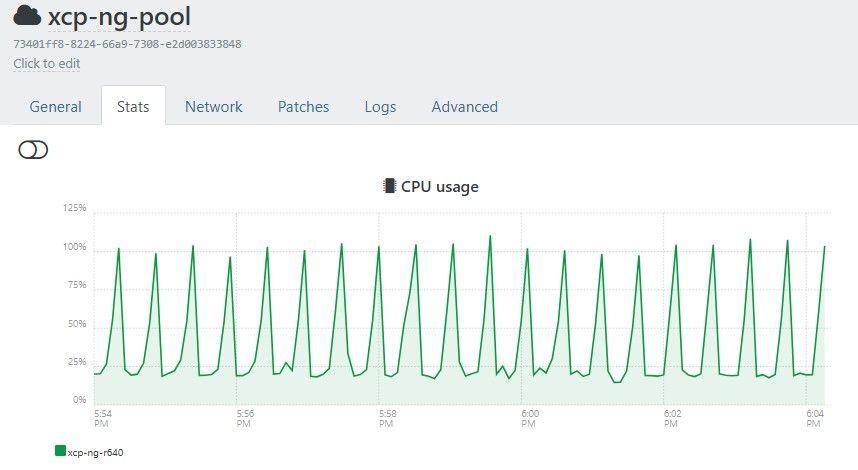
                          haaaa on the pool stats, it spikes to 50% (but I have 2 hosts in this pool)
                          ac5f6702-3e3a-434d-bb01-3bc99d997aa4-image.jpeg

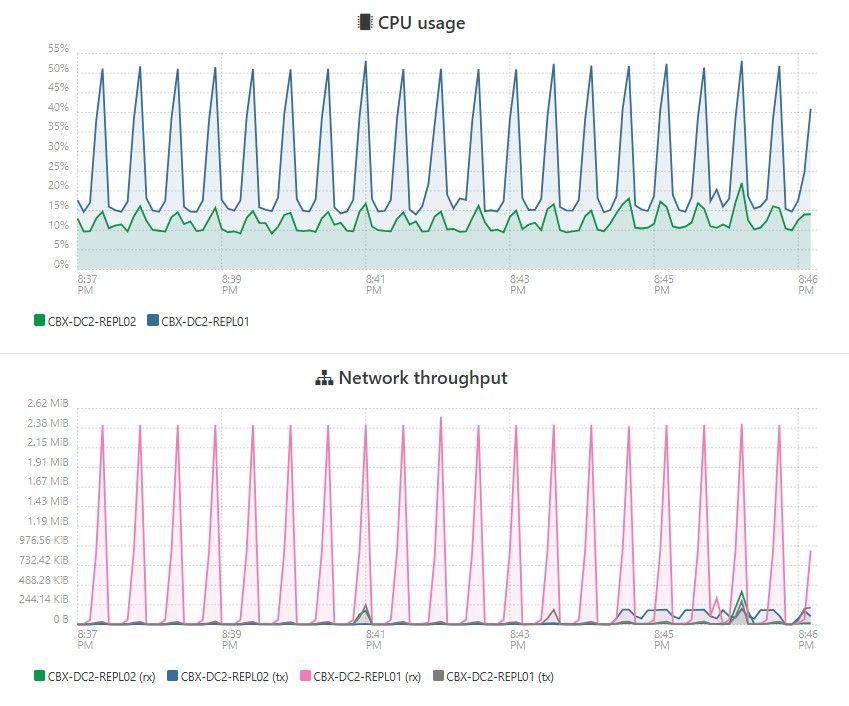
                          my guess ? false positive 🙂 real monitoring do not add up to what we see in XOA stats.
                          I think we're down a rabbit hole

                          @olivierlambert told once that these stat graphs have not been updated for 10 years.

                          1 Reply Last reply Reply Quote 0
                          • P Online
                            Pilow @jerry1333
                            last edited by Pilow

                            @jerry1333 said:

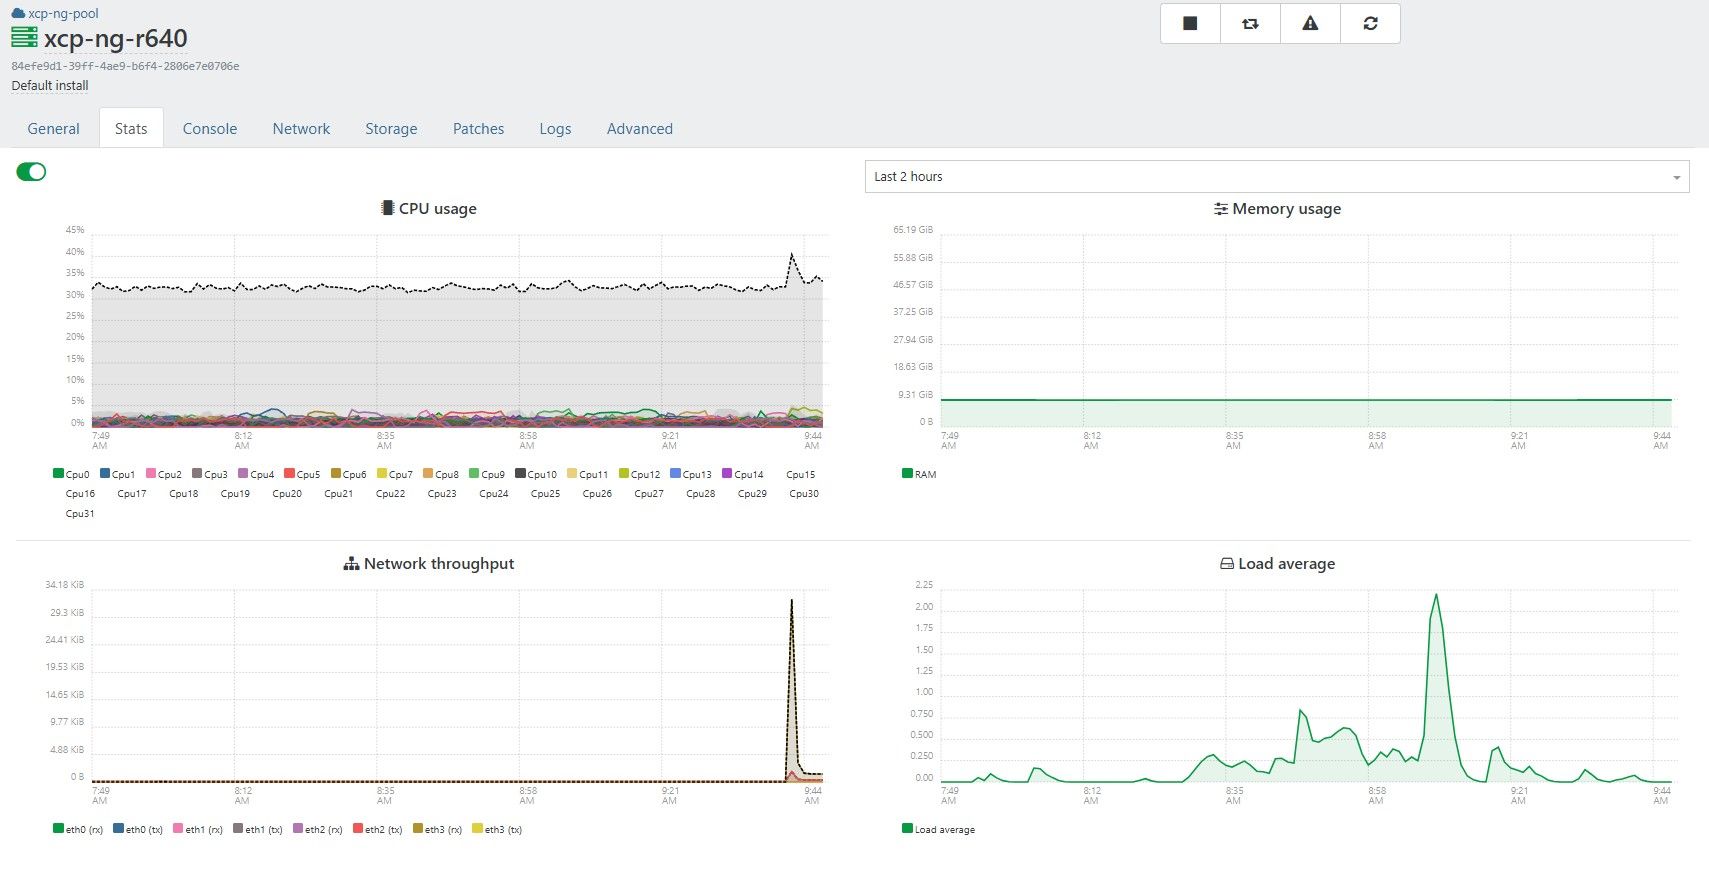
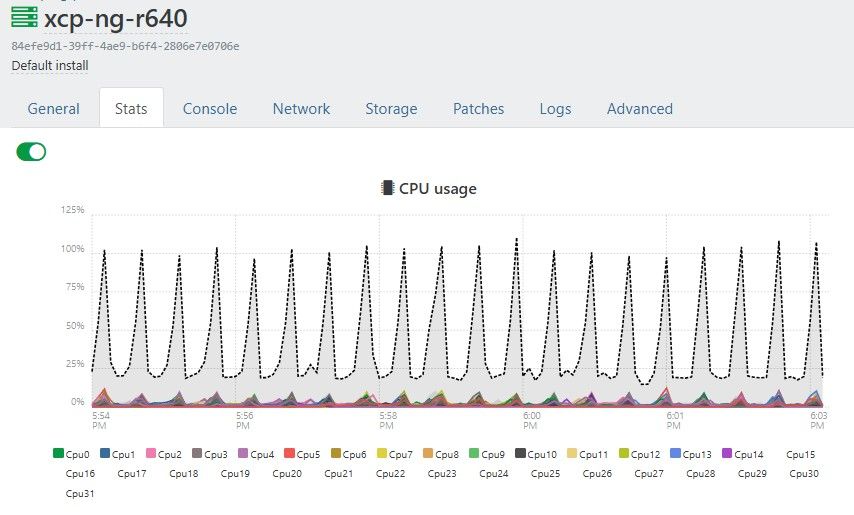
                            There is nothing else on that host and this is only host in pool but it's using 30% of cpu all the time?

                            it's not using 30% of CPU, you see a graph of cumulated (switch is on) core consumption of your 32 cores.

                            never switch this on. it adds up like that : 32x1%=32%, wrongfully letting you think you are at 30%ish CPU usage.

                            1 Reply Last reply Reply Quote 0

                            Hello! It looks like you're interested in this conversation, but you don't have an account yet.

                            Getting fed up of having to scroll through the same posts each visit? When you register for an account, you'll always come back to exactly where you were before, and choose to be notified of new replies (either via email, or push notification). You'll also be able to save bookmarks and upvote posts to show your appreciation to other community members.

                            With your input, this post could be even better 💗

                            Register Login
                            • First post
                              Last post