usage-report description
-
Hi,
Is there a description somewhere how the usage-report plugin is measuring each type of statistic?
It looks like some kind of average over time, but for what period in that case?
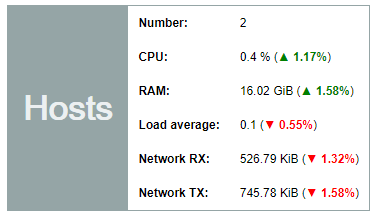
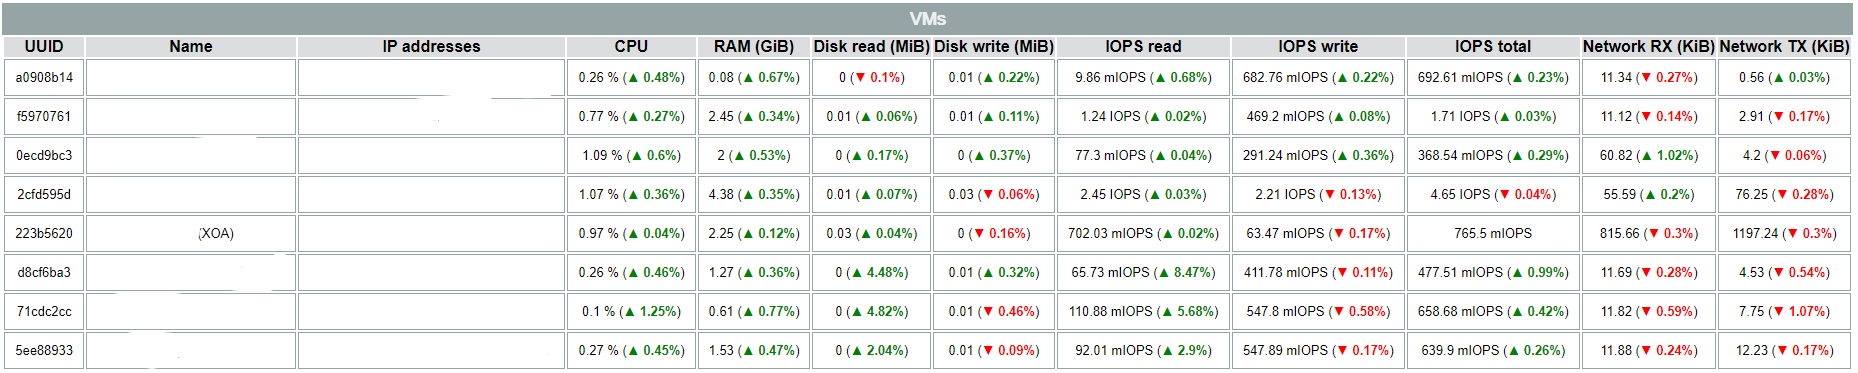
For example. XOA runs backups every 4 hours and they are several GiB each time. But in the report it looks like only a few hundred KiB network traffic. Also disk read/write/IOPS seems completely wrong for all VMs.
-
It's the time since the previous report
") It's an average.
It's an average. -
@olivierlambert I see. This means average should be over the past 24 hours since it arrives 8am every day
I wonder if the report could be improved with detected min/max (over a configurable threashold period of x seconds) as well as the average?
-
Feel free to ask for a feature request, as long it's well described in terms of the "what I need" functionally
Hello! It looks like you're interested in this conversation, but you don't have an account yet.
Getting fed up of having to scroll through the same posts each visit? When you register for an account, you'll always come back to exactly where you were before, and choose to be notified of new replies (either via email, or push notification). You'll also be able to save bookmarks and upvote posts to show your appreciation to other community members.
With your input, this post could be even better 💗
Register Login