XCP-ng
    • Categories
    • Recent
    • Tags
    • Popular
    • Users
    • Groups
    • Register
    • Login

    CPU radio buttons on usage graph

    Scheduled Pinned Locked Moved Xen Orchestra
    15 Posts 5 Posters 391 Views 4 Watching
    Loading More Posts
    • Oldest to Newest
    • Newest to Oldest
    • Most Votes
    Reply
    • Reply as topic
    Log in to reply
    This topic has been deleted. Only users with topic management privileges can see it.
    • B Offline
      blueh2o
      last edited by

      a807057b-4917-4a5a-a20a-9cada208ddfb-image.png
      What are these buttons actually supposed to do? When I toggle them, the graph changes for a moment then goes right back to how it was before.

      1 Reply Last reply Reply Quote 0
      • olivierlambertO Online
        olivierlambert Vates 🪐 Co-Founder CEO
        last edited by

        Hi,

        I suppose you are talking about the graph legend?

        D 1 Reply Last reply Reply Quote 0
        • D Offline
          DustinB @olivierlambert
          last edited by

          @olivierlambert I think so.

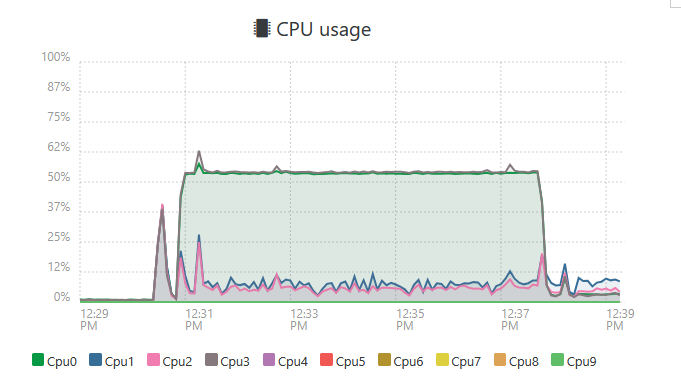
          @blueh2o you should be able to disable a specific CPU graph to see what your other (or a specific Core is doing).

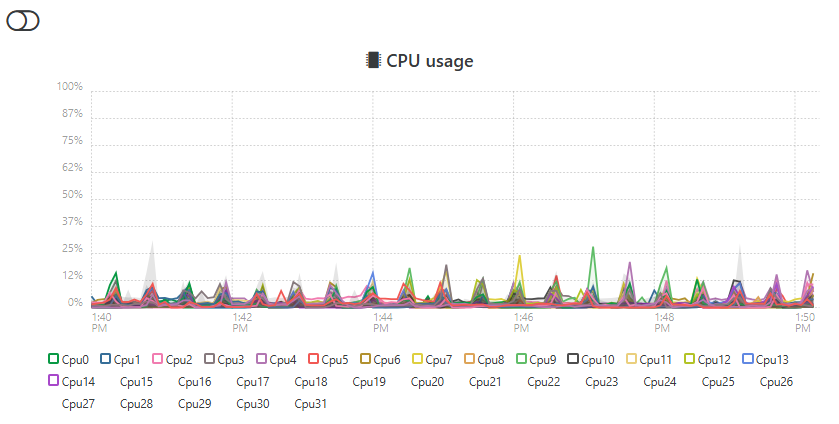
          For example I have 32 cores on my hypervisor and while I can't disable every core, ideally you can take a look to see if a specific core is getting slammed with work.

          5fecb277-9749-4b3c-846d-24bceccffb82-image.png

          B 1 Reply Last reply Reply Quote 0
          • B Offline
            blueh2o @DustinB
            last edited by

            @DustinB exactly. I figured that's what they were for but they don't seem to work for me.

            D 1 Reply Last reply Reply Quote 0
            • D Offline
              DustinB @blueh2o
              last edited by

              @blueh2o said in CPU radio buttons on usage graph:

              @DustinB exactly. I figured that's what they were for but they don't seem to work for me.

              What version of XO are you using?

              B 1 Reply Last reply Reply Quote 0
              • B Offline
                blueh2o @DustinB
                last edited by

                @DustinB commit 8f2b8

                D 1 Reply Last reply Reply Quote 0
                • D Offline
                  DustinB @blueh2o
                  last edited by

                  @blueh2o said in CPU radio buttons on usage graph:

                  @DustinB commit 8f2b8

                  This looks like it was released on Sept 16, if you update to the latest is this still an issue?

                  B 1 Reply Last reply Reply Quote 0
                  • B Offline
                    blueh2o @DustinB
                    last edited by

                    @DustinB Still there in commit d77d6. The deselected CPU disappears from the graph but reappears when it refreshes.

                    D 1 Reply Last reply Reply Quote 0
                    • D Offline
                      DustinB @blueh2o
                      last edited by

                      @blueh2o said in CPU radio buttons on usage graph:

                      @DustinB Still there in commit d77d6. The deselected CPU disappears from the graph but reappears when it refreshes.

                      "refreshes" like when you press F5 in your browser?

                      1 Reply Last reply Reply Quote 0
                      • A Offline
                        acebmxer
                        last edited by acebmxer

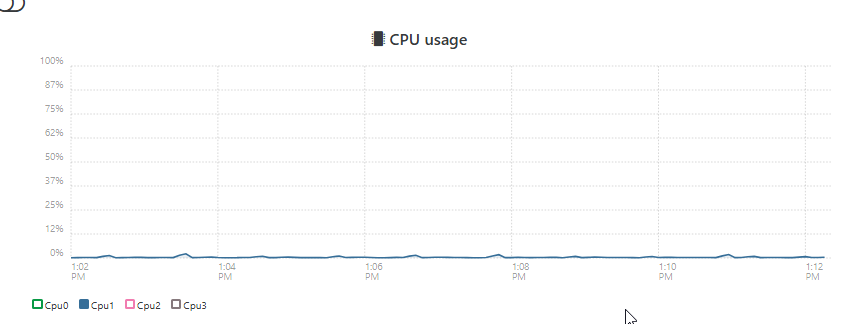
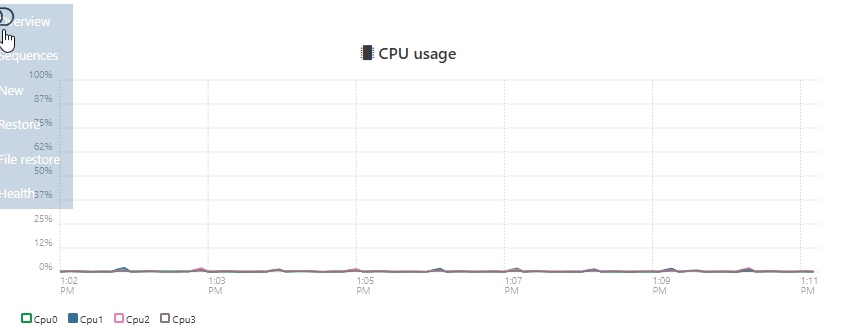
                        I just tried this myself and noticing the same outcome. If you deselect a core. That line will remove from the graph momentarily. Then the graph will refresh and that core will be show in the graph while deselected.

                        no page refresh needed.

                        https://drive.google.com/file/d/1DzoLItM8fpj0Jn04L_tv31mUjcUxo1cC/view?usp=sharing

                        D 1 Reply Last reply Reply Quote 1
                        • D Offline
                          DustinB @acebmxer
                          last edited by

                          Hrm...

                          Same thing here too, never noticed it until now.

                          8215e43a-b987-4db4-9a9e-ec0136e0be29-image.png

                          f5d0fdcb-494b-4318-8beb-3a6e6808d708-image.png

                          Must be some sort of bug

                          1 Reply Last reply Reply Quote 0
                          • A Offline
                            acebmxer
                            last edited by acebmxer

                            I posted a video recording of it, hope that helps.

                            1 Reply Last reply Reply Quote 0
                            • olivierlambertO Online
                              olivierlambert Vates 🪐 Co-Founder CEO
                              last edited by

                              Those graph are 10y old, and XO 6 will be the default UI in XO 6, so I think we can confidently said we won't take time to debug those old graphs.

                              D 1 Reply Last reply Reply Quote 1
                              • D Offline
                                DustinB @olivierlambert
                                last edited by

                                @olivierlambert said in CPU radio buttons on usage graph:

                                Those graph are 10y old, and XO 6 will be the default UI in XO 6, so I think we can confidently said we won't take time to debug those old graphs.

                                Kind of what I had figured. That XO6 is the way forward.

                                P 1 Reply Last reply Reply Quote 0
                                • P Online
                                  Pilow @DustinB
                                  last edited by

                                  @DustinB with Easyvirt integrated in the stack ♥

                                  1 Reply Last reply Reply Quote 0
                                  • First post
                                    Last post