Lots of performance alerts after upgrading XO to commit aa490
-
@olivierlambert
One strange note when I get the alarms on e-mail during a full backup of my running XOAlert: vm cpu usage > 65%, XO 67,8%End of alert: vm cpu usage > 65% SyncMate 0,3%End of alert is the wrong VM, should be XO.
In Dashboard/Health it's OK, it says XO in both alert and end of alert ??Not a big deal for me, but I thought might as well report it
-
Might be a bug, worth pinging @MathieuRA
-
P ph7 referenced this topic on
-
@ph7 I'm seeing the same thing as you, where I'm getting a mismatch between the server that is sending out the alert and then ending the alert. Just like you, it is actually the XO server that is truly the one that should be alerting. The second server (and it's always the same second server) is NOT having any issues with CPU or memory usage but is being drug into the alerts for some strange reason.
I'm currently on Commit 2e8d3 running Xen from sources. Yes, I know I'm 5 commits behind right now, and will update as soon as I finish this message. However, this issue has been going on for me for some time now and when I saw others with the same issue, I figured I'd add to the chain.
One other thing that happed around the same time this issue started... it seems the Average Length value for alerts are being ignored, or are at least being handled differently than they had previously. For example, I have my CPU alert set to trip if it exceeds 90% for over 600 seconds. Before the issue started, if I had a long running backup, my CPU would go over 90% and could sometimes stay there for an hour or more. During that period, I would get a single alert after the CPU was over 90% for that period of time and then Xen was "smart" enough that it would keep an eye on the average, so a brief couple second dip below 90% would NOT send out an "end of alert" and then a second "alert" message when the CPU went over 90% once again. This is not happening anymore... if the CPU spikes over my 90% threshold, I get an almost immediate alert message. The instant the CPU goes below the 90% threshold, I get an immediate end of alert message. If threshold goes back over 90%, even a few seconds later, I get yet another alert message.
This has had the effect where instead of getting a single message that spans the duration of the time the threshold is exceeded, where brief dips below were ignored if they were only a few seconds long, I am now getting an alert/end of alert/alert sequence for every seconds-long dip in CPU usage. Last night, for example, I received over 360 alert e-mails because of this, with many happening within seconds:
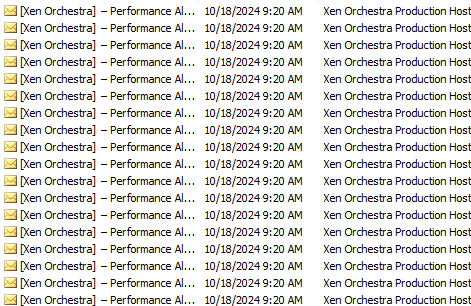
So... just confirming what @ph7 has been seeing... alerts are sending out from one server and a second sends the end-of-alerts, and for some reason the ability of Xen to average the alerts over the selected period of time so messages aren't sent out with every single seconds-long dip below the threshold is no longer working, as well.
Thanks!
-
Also ping @Bastien-Nollet & @MathieuRA since it seems also visible here
-
Hi. I am finally able to reproduce the end of alert issue.
However, I was only able to reproduce if I used the "ALL *" options and not by manually selecting the objects to monitor. Can you confirm that you are usingAll running VMs/Hosts/SRs? -
@MathieuRA Yes, I can confirm I am using the All Running VMs and All Running Hosts (I am not using All Running SRs, but I never get alerts for those because I have a LOT of free disk space).
I did place an exclusion for one of my VMs (the one that was generating dozens and dozens of alerts) to cut down on some of that chatter, but even with one machine excluded, when I do get a report from one of the other VMs it still has the same issue: the proper VM will generate the alert, but an improper VM will be reported in the end of alert message.
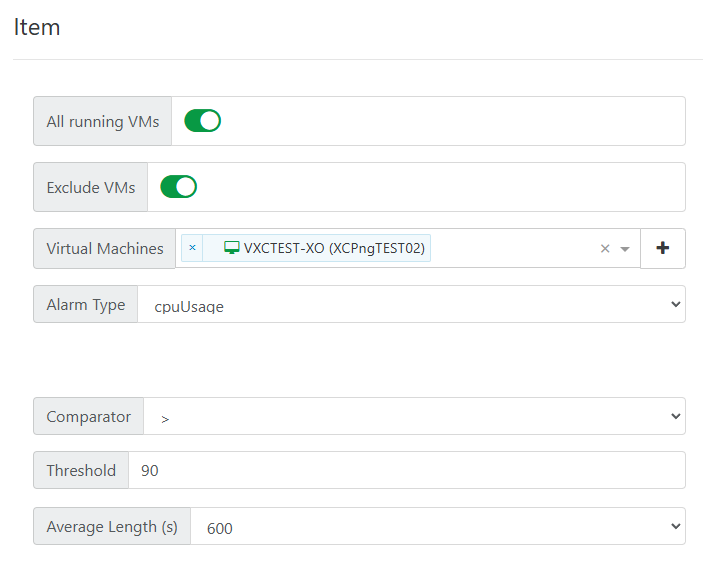
So... as far as I can tell, we still have the issue with the improper machine identification and the Average Length field is ignored so a machine that pops over the threshold, then briefly under the threshold for a few seconds, then back over the threshold again will generate three messages (alert, end of alert, alert) in several seconds instead of looking at the average to make sure the dip isn't just a brief one.
Hopefully that makes sense.
Thanks again!
-
@JamfoFL As the bug appears to be non-trivial, I’ll create the issue on our end, and then we’ll see with the team to schedule this task. We’ll keep you updated here.
-
@MathieuRA
Yes, All running hosts and all running VMs -
 B Bastien Nollet referenced this topic on
-
@MathieuRA Thanks so much! I appreciate all the effort!
-
@ph7 said in Lots of performance alerts after upgrading XO to commit aa490:
@olivierlambert
One strange note when I get the alarms on e-mail during a full backup of my running XOAlert: vm cpu usage > 65%, XO 67,8%End of alert: vm cpu usage > 65% SyncMate 0,3%End of alert is the wrong VM, should be XO.
In Dashboard/Health it's OK, it says XO in both alert and end of alert ??Not a big deal for me, but I thought might as well report it
I added a new VM and put it in a backup job (which had a concurrency of 2) and got these new alerts:
ALERT: VM CPU usage > 80% XO5: 80.4%
End of alert: vm cpu usage > 80% HomeAssistant: 6,7%
It seems like the reporting has changed and is reporting the latest VM.The host alert is reporting in the same way
ALERT: host memory usage > 90% X2 🚀: 92.7% used
END OF ALERT: host memory usage > 90% X1: 11.3%I have changed all jobs to concurrency 1 and I have not got any SR alert
-
-
@Bastien-Nollet
Hi
I updated my test server and a copy of a Ronivay XO1st run
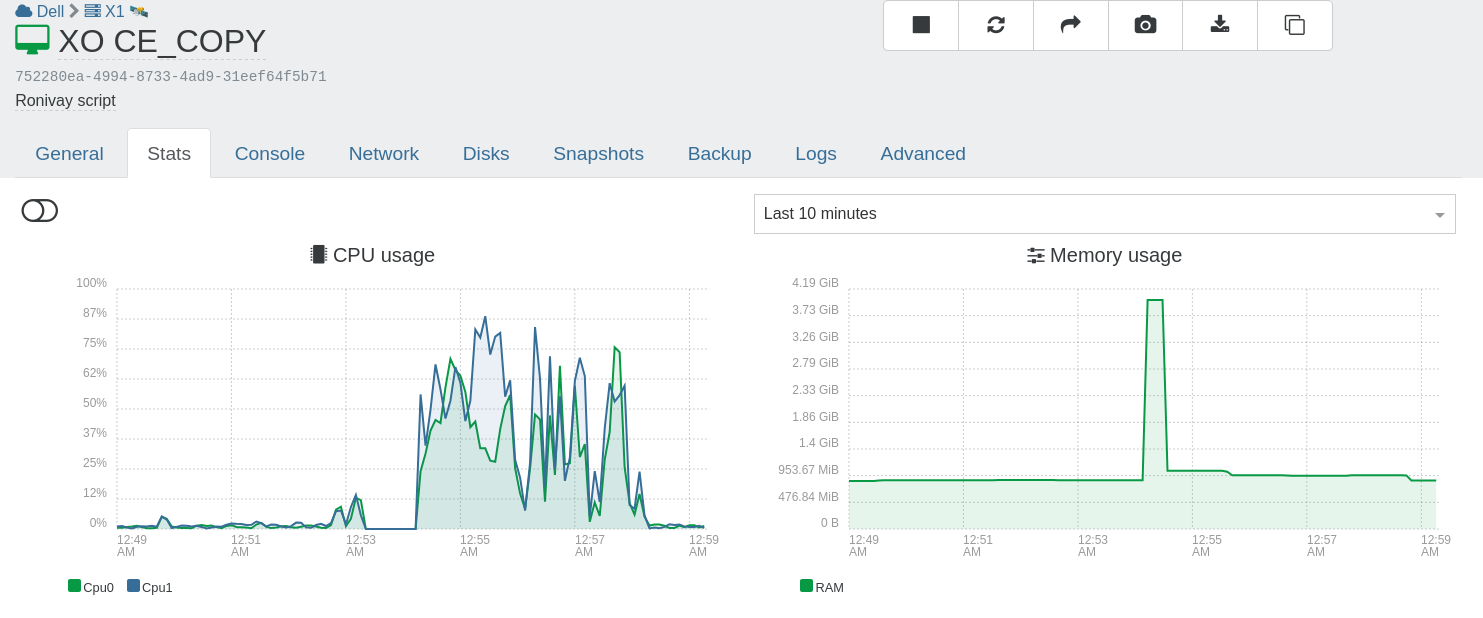
Host:


I only got 1+1 alert on e-mail, that seems OK.
2nd run
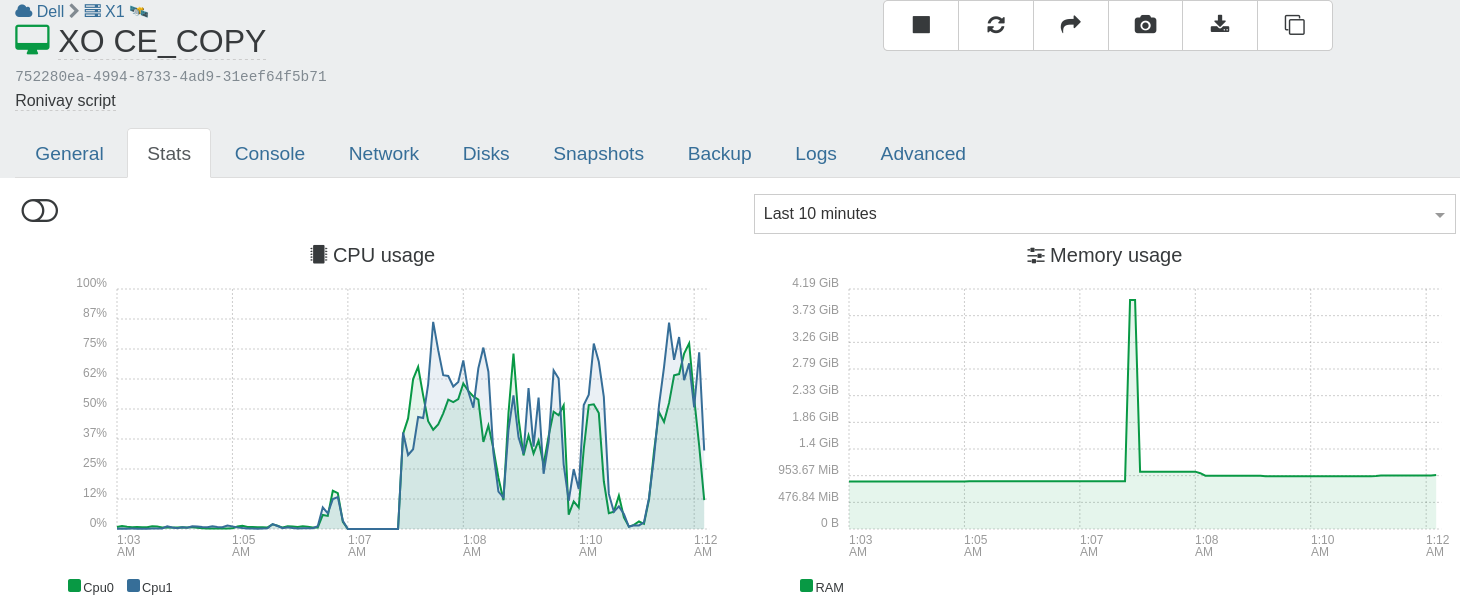
This time NO alert.

Maybe You should check some more
I will test again tomorrow, Good night... -
@ph7
And it did report the correct VM at the end of alert -
@ph7
3rd run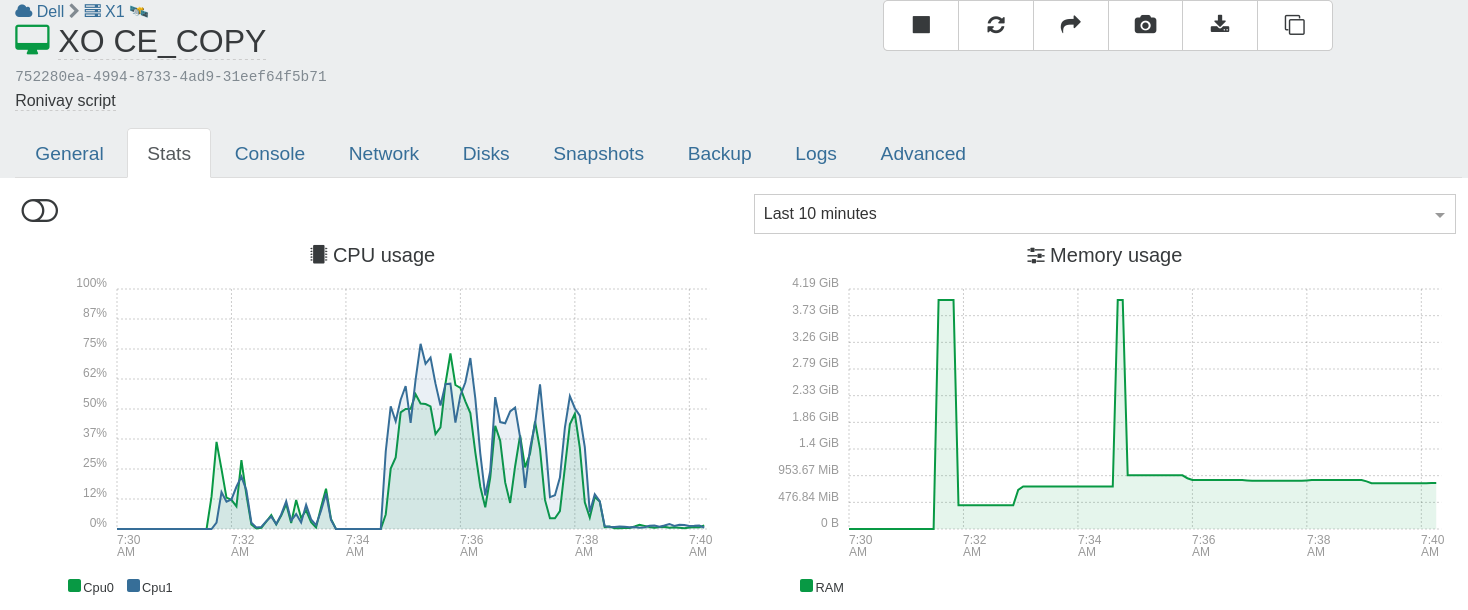
No alert.
Somehow, the CPU usage is lower.
I shall lower the alert limits to see what happens.4th run with 55% limit
I got 1+1 alarms this time.5th run
I got 1+1 alarms this time to.6th run
Increased the concurrency to 2.
this did put some more stress on the system.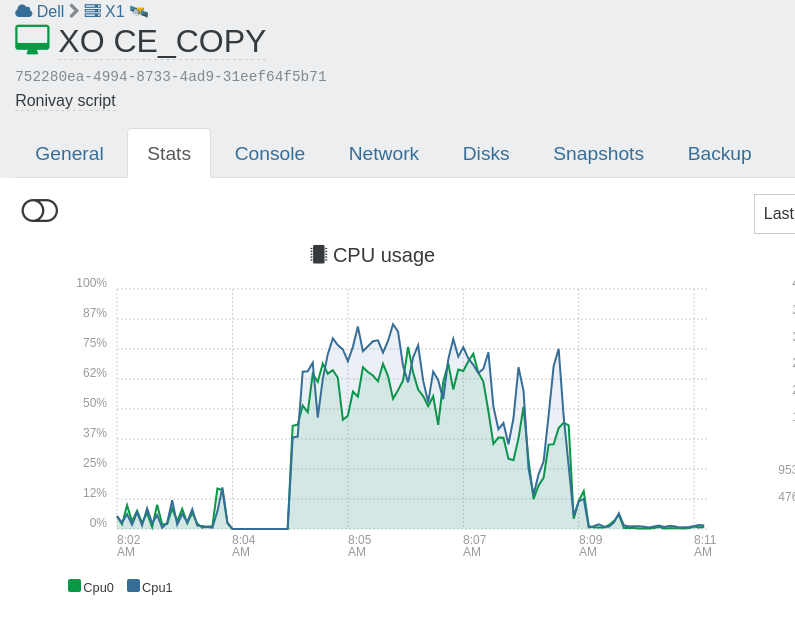
only 1+1 alerts again.
Seems like You nailed it.Maybe You should check some more

And I am sorry for that, I was wrong

-
@Bastien-Nollet
More problems
I previous had 2 XO disabled from the alerts.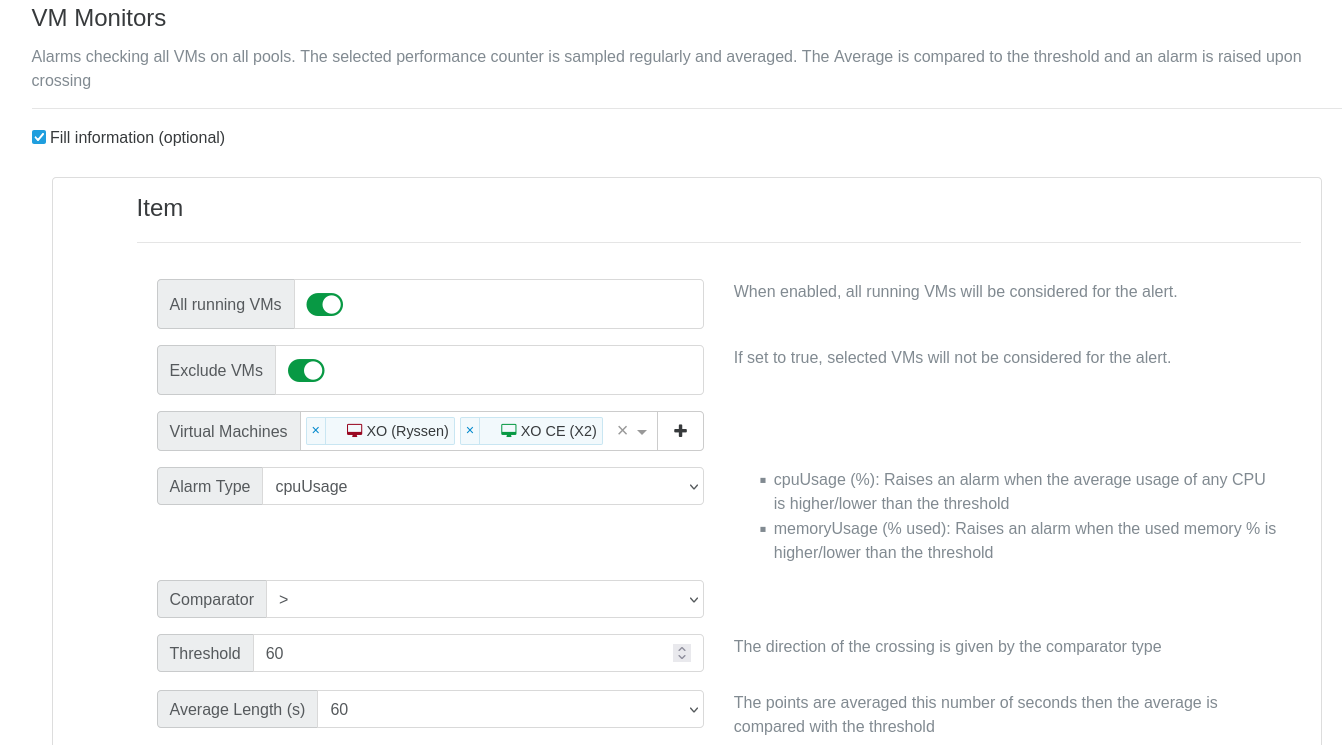
But when I decided to remove both of them from the exclude or if I toggle the green
exclude VMs"switch", I got this error:plugin.configure { "id": "perf-alert", "configuration": { "baseUrl": "Removed", "hostMonitors": [ { "smartMode": true, "alarmTriggerLevel": 60, "alarmTriggerPeriod": 60 }, { "smartMode": true, "variableName": "memoryUsage", "alarmTriggerLevel": 90 } ], "toEmails": [ "Removed" ], "vmMonitors": [ { "smartMode": true, "alarmTriggerLevel": 60, "alarmTriggerPeriod": 60, "excludeUuids": false, "uuids": [ "2f819438-5ab1-7309-99b0-7116313a03fe", "ee56c3c7-fd7d-c9aa-b2e1-ee698267e241" ] } ], "srMonitors": [ { "smartMode": false, "uuids": [], "excludeUuids": false } ] } } { "code": 10, "data": { "errors": [ { "instancePath": "/vmMonitors/0/smartMode", "schemaPath": "#/properties/vmMonitors/items/oneOf/0/properties/smartMode/anyOf/0/not", "keyword": "not", "params": {}, "message": "must NOT be valid" }, { "instancePath": "/vmMonitors/0/smartMode", "schemaPath": "#/properties/vmMonitors/items/oneOf/0/properties/smartMode/anyOf/1/const", "keyword": "const", "params": { "allowedValue": false }, "message": "must be equal to constant" }, { "instancePath": "/vmMonitors/0/smartMode", "schemaPath": "#/properties/vmMonitors/items/oneOf/0/properties/smartMode/anyOf", "keyword": "anyOf", "params": {}, "message": "must match a schema in anyOf" }, { "instancePath": "/vmMonitors/0/uuids", "schemaPath": "#/properties/vmMonitors/items/oneOf/1/properties/uuids/not", "keyword": "not", "params": {}, "message": "must NOT be valid" }, { "instancePath": "/vmMonitors/0/excludeUuids", "schemaPath": "#/properties/vmMonitors/items/oneOf/2/properties/excludeUuids/const", "keyword": "const", "params": { "allowedValue": true }, "message": "must be equal to constant" }, { "instancePath": "/vmMonitors/0", "schemaPath": "#/properties/vmMonitors/items/oneOf", "keyword": "oneOf", "params": { "passingSchemas": null }, "message": "must match exactly one schema in oneOf" } ] }, "message": "invalid parameters", "name": "XoError", "stack": "XoError: invalid parameters at invalidParameters (/opt/xo/xo-builds/xen-orchestra-202503081124/packages/xo-common/api-errors.js:26:11) at default._configurePlugin (file:///opt/xo/xo-builds/xen-orchestra-202503081124/packages/xo-server/src/xo-mixins/plugins.mjs:175:13) at default.configurePlugin (file:///opt/xo/xo-builds/xen-orchestra-202503081124/packages/xo-server/src/xo-mixins/plugins.mjs:199:16) at Xo.configure (file:///opt/xo/xo-builds/xen-orchestra-202503081124/packages/xo-server/src/api/plugin.mjs:12:3) at Task.runInside (/opt/xo/xo-builds/xen-orchestra-202503081124/@vates/task/index.js:175:22) at Task.run (/opt/xo/xo-builds/xen-orchestra-202503081124/@vates/task/index.js:159:20) at Api.#callApiMethod (file:///opt/xo/xo-builds/xen-orchestra-202503081124/packages/xo-server/src/xo-mixins/api.mjs:469:18)" }I then tried to remove 1 VM , OK
Removed the 2nd one, OK
But when I tried to toggle the green switch I got this errorplugin.configure { "id": "perf-alert", "configuration": { "baseUrl": "Removed", "hostMonitors": [ { "smartMode": true, "alarmTriggerLevel": 60, "alarmTriggerPeriod": 60 }, { "smartMode": true, "variableName": "memoryUsage", "alarmTriggerLevel": 90 } ], "toEmails": [ "Removed" ], "vmMonitors": [ { "smartMode": true, "alarmTriggerLevel": 60, "alarmTriggerPeriod": 60, "excludeUuids": false, "uuids": [] } ], "srMonitors": [ { "smartMode": false, "uuids": [], "excludeUuids": false } ] } } { "code": 10, "data": { "errors": [ { "instancePath": "/vmMonitors/0/smartMode", "schemaPath": "#/properties/vmMonitors/items/oneOf/0/properties/smartMode/anyOf/0/not", "keyword": "not", "params": {}, "message": "must NOT be valid" }, { "instancePath": "/vmMonitors/0/smartMode", "schemaPath": "#/properties/vmMonitors/items/oneOf/0/properties/smartMode/anyOf/1/const", "keyword": "const", "params": { "allowedValue": false }, "message": "must be equal to constant" }, { "instancePath": "/vmMonitors/0/smartMode", "schemaPath": "#/properties/vmMonitors/items/oneOf/0/properties/smartMode/anyOf", "keyword": "anyOf", "params": {}, "message": "must match a schema in anyOf" }, { "instancePath": "/vmMonitors/0/uuids", "schemaPath": "#/properties/vmMonitors/items/oneOf/1/properties/uuids/not", "keyword": "not", "params": {}, "message": "must NOT be valid" }, { "instancePath": "/vmMonitors/0/excludeUuids", "schemaPath": "#/properties/vmMonitors/items/oneOf/2/properties/excludeUuids/const", "keyword": "const", "params": { "allowedValue": true }, "message": "must be equal to constant" }, { "instancePath": "/vmMonitors/0", "schemaPath": "#/properties/vmMonitors/items/oneOf", "keyword": "oneOf", "params": { "passingSchemas": null }, "message": "must match exactly one schema in oneOf" } ] }, "message": "invalid parameters", "name": "XoError", "stack": "XoError: invalid parameters at invalidParameters (/opt/xo/xo-builds/xen-orchestra-202503081124/packages/xo-common/api-errors.js:26:11) at default._configurePlugin (file:///opt/xo/xo-builds/xen-orchestra-202503081124/packages/xo-server/src/xo-mixins/plugins.mjs:175:13) at default.configurePlugin (file:///opt/xo/xo-builds/xen-orchestra-202503081124/packages/xo-server/src/xo-mixins/plugins.mjs:199:16) at Xo.configure (file:///opt/xo/xo-builds/xen-orchestra-202503081124/packages/xo-server/src/api/plugin.mjs:12:3) at Task.runInside (/opt/xo/xo-builds/xen-orchestra-202503081124/@vates/task/index.js:175:22) at Task.run (/opt/xo/xo-builds/xen-orchestra-202503081124/@vates/task/index.js:159:20) at Api.#callApiMethod (file:///opt/xo/xo-builds/xen-orchestra-202503081124/packages/xo-server/src/xo-mixins/api.mjs:469:18)" } -
Some of the errors you encountered are intended. We don't allow values in the "Virtual Machines" field if "Exclude VMs" is disabled and "All running VMs" is enabled, because it would make the plugin configuration confusing.
However you're right, there seems to be an issue when the VMs are selected and then removed. The value becomes an empty list instead of being undefined, which causes the validation to fail when we try to turn off the "Exclude VMs" option.
I'm going to create a task on our side so that we can plan to resolve this problem.
In the meantime you can work around the problem by deleting the monitor and recreating a new one with the same parameters.
Hello! It looks like you're interested in this conversation, but you don't have an account yet.
Getting fed up of having to scroll through the same posts each visit? When you register for an account, you'll always come back to exactly where you were before, and choose to be notified of new replies (either via email, or push notification). You'll also be able to save bookmarks and upvote posts to show your appreciation to other community members.
With your input, this post could be even better 💗
Register Login