Bad Performance CPU? get-cpufreq-para failed
-
@Affonso thanks for this...
doese the cpu boost the frequency on load or is the cpu permanetly on 2,7ghz
-
What's the load average on your Dom0? What's the current resources allocated to it? (vCPUs and memory)? Might be interesting to check also the load on the SR (eg with
iostat -x) -
@high-voltages I believe turbo boost takes it up to 3.3GHz. The 2.7 is reduced workload
-
In guests (even privileded guest like dom0),
/proc/cpuinforeports only what xen exposes to it, it generally is shown as fixed value.You can only get some more insight using
xenpmwhen it actually shows something. I found it commonly having parts working or not depending on the CPU. On a xeon here, I get the same as you withget-cpufreq-parabut you can have a look atget-cpufreq-averagewhich is generally working, here you can see the frequency moving, on an idle machine it should be lower, and get higher with load.Hope this helps.
-
Thanks for the Feedback @ all
I have tested some commands from above and discovered something
a good working host system:
iostat -x
Linux 4.19.0+1 (xcpngautewe)    02/27/2024      _x86_64_        (8 CPU)

avg-cpu:  %user   %nice %system %iowait  %steal   %idle
           0.18    0.00    0.34    0.00    0.07   99.41

Device:         rrqm/s   wrqm/s     r/s     w/s    rkB/s    wkB/s avgrq-sz avgqu-sz   await r_await w_await  svctm  %util
nvme0n1           0.04     0.08    2.02    2.50   135.07   202.56   149.24     0.00    0.30    0.27    0.32   0.21   0.10
sda               0.08     0.81    2.29    3.26   126.80   161.85   104.05     0.00    0.57    0.69    0.48   0.29   0.16
dm-0              0.00     0.00    0.00    0.00     0.47     0.00   244.40     0.00    0.81    0.82    0.00   0.81   0.00
dm-1              0.00     0.00    0.00    0.00     0.33     0.00   215.58     0.00    0.86    0.91    0.04   0.86   0.00
dm-2              0.00     0.00    0.00    0.00     0.00     0.00    21.18     0.00    0.19    0.16    0.23   0.19   0.00
dm-3              0.00     0.00    0.21    0.21    12.58    11.83   117.71     0.00    0.71    0.97    0.46   0.33   0.01
tda               0.00     0.00    0.00    0.00     0.00     0.00    39.09     0.00    0.55    0.55    0.00   0.15   0.00
tdb               0.00     0.00    0.00    0.00     0.00     0.00    39.09     0.00    0.55    0.55    0.00   0.15   0.00
in comparison to the slow host system:
iostat -x
Linux 4.19.0+1 (localhost.localdomain)  02/27/2024      _x86_64_        (16 CPU)

avg-cpu:  %user   %nice %system %iowait  %steal   %idle
           0.29    0.00    0.53    0.02    0.03   99.13

Device:         rrqm/s   wrqm/s     r/s     w/s    rkB/s    wkB/s avgrq-sz avgqu-sz   await r_await w_await  svctm  %util
sda               0.14     0.91    6.54    7.67   308.70   284.24    83.43     0.10    7.15    3.08   10.62   2.96   4.21
sdb               0.00     0.00    0.01    0.00     1.33     0.00   254.01     0.00    1.61    1.61    7.25   1.60   0.00
dm-0              0.00     0.00    0.00    0.00     0.54     0.00   253.31     0.00    1.78    1.73   34.50   1.76   0.00
dm-5              0.00     0.00    0.20    0.17    20.11     2.27   119.98     0.00    4.71    0.91    9.28   2.41   0.09
tdc               0.00     0.00    0.00    0.00     0.04     0.00    81.29     0.00   27.58   27.58    0.00   7.40   0.00
sdc               0.00     0.00    0.01    0.00     0.53     0.00   126.86     0.00    4.08    4.08    0.00   2.24   0.00
dm-1              0.00     0.00    1.26    1.76    49.67    39.38    59.01     0.02    5.22    2.67    7.05   4.00   1.21
dm-2              0.00     0.00    0.12    0.14    21.73    24.61   345.21     0.00    9.35    4.45   13.56   3.18   0.09
dm-3              0.00     0.00    0.11    0.00     2.20     0.00    41.97     0.00    0.97    0.97    0.00   0.84   0.01
dm-4              0.00     0.00    0.27    0.00    12.30     0.00    90.10     0.00    3.15    3.15    0.00   2.56   0.07
tda               0.00     0.00    0.00    0.00     0.00     0.00    39.09     0.00    2.42    2.42    0.00   1.28   0.00
tdb               0.00     0.00    0.00    0.00     0.00     0.00    39.09     0.00    0.60    0.60    0.00   0.23   0.00
dm-6              0.00     0.00    0.11    0.10     5.00     4.04    87.11     0.00    6.31    2.74   10.09   3.63   0.08
tdd               0.00     0.00    0.00    0.00     0.00     0.00    39.09     0.00    0.53    0.53    0.00   0.38   0.00
dm-7              0.00     0.00    0.04    0.00     1.96     0.04    88.39     0.00    4.69    4.02   15.47   3.11   0.01
tde               0.00     0.00    0.00    0.00     0.00     0.00    39.09     0.00    0.57    0.57    0.00   0.38   0.00
dm-8              0.00     0.00    0.00    0.00     0.00     0.00    45.15     0.00   11.98    7.87   20.20  10.80   0.00
dm-9              0.00     0.00    0.00    0.00     0.00     0.00    38.85     0.00   12.60    6.04   23.95  11.96   0.00
dm-10             0.00     0.00    0.07    0.04     1.97     1.26    58.93     0.00   10.88    7.96   15.34   2.78   0.03
dm-11             0.00     0.00    0.00    0.00     0.00     0.00    28.84     0.00   12.16   12.16    0.00   7.12   0.00
dm-12             0.00     0.00    0.00    0.00     0.00     0.00    41.06     0.00   10.25   10.25    0.00   6.90   0.00
dm-13             0.00     0.00    0.00    0.00     0.00     0.00    54.52     0.00    5.10    5.10    0.00   5.02   0.00
dm-14             0.00     0.00    0.04    0.00     1.36     0.00    67.46     0.00    4.38    4.38    0.00   2.27   0.01
dm-15             0.00     0.00    0.01    0.00     0.12     0.00    48.19     0.00    7.59    7.59    0.00   6.14   0.00
tdf               0.00     0.00    0.00    0.00     0.00     0.00    39.09     0.00   48.68   48.68    0.00   7.17   0.00
tdg               0.00     0.00    0.00    0.00     0.00     0.00    39.09     0.00   30.45   30.45    0.00   4.98   0.00
tdh               0.00     0.00    0.00    0.00     0.00     0.00    39.09     0.00    1.45    1.45    0.00   0.60   0.00
the columns with the wait timings are much higher than the from the fast host
that’s very strange from my point of view.further the CPU stat does not shows correct values because the fast host was at the time of the command under heavy load with about 80%.
on the slow was some load but there the CPU is much stronger
@bleader: the comand "get-cpufreq-average" gives no output at all.
-
@high-voltages so nothing there hints you to a problem with the drive SDA on the slow "host"?
-
@high-voltages you also can try
xenpm start 10to gather info for 10s and it will print a sumarry at the end, in my case it had each core average frequency, not sure you'll get it too, but you can give it a shot. -
@bleader I am running into the same issue on a pair of Lenovo SR630 V4s with Intel Xeon 6530P CPUs
[08:23 xcpng-dr-2 ~]# xenpm get-cpufreq-para
[CPU0] failed to get cpufreq parameter
Playing with different workload profiles in the bios but so far the server seems to pretty aggressively clock itself down even while CPU intensive tasks like backups are running. I am of course not able to run something like xenpm set-scaling-governor performance either.
EDIT: The solution here is to get "Power/Performance Bias:" to OS Controlled in the servers BIOS. This restores functionality.
-
@flakpyro oh, good to know, thanks for sharing this!
@poddingue this might be worth some investigation to document, but likely would need to gather similar settings for a set of vendors to make it relevant.
-
EDIT: The solution here is to get "Power/Performance Bias:" to OS Controlled in the servers BIOS. This restores functionality.
hey nice !
I did the modification on a slave server and I now have all informations (previously FAILED)
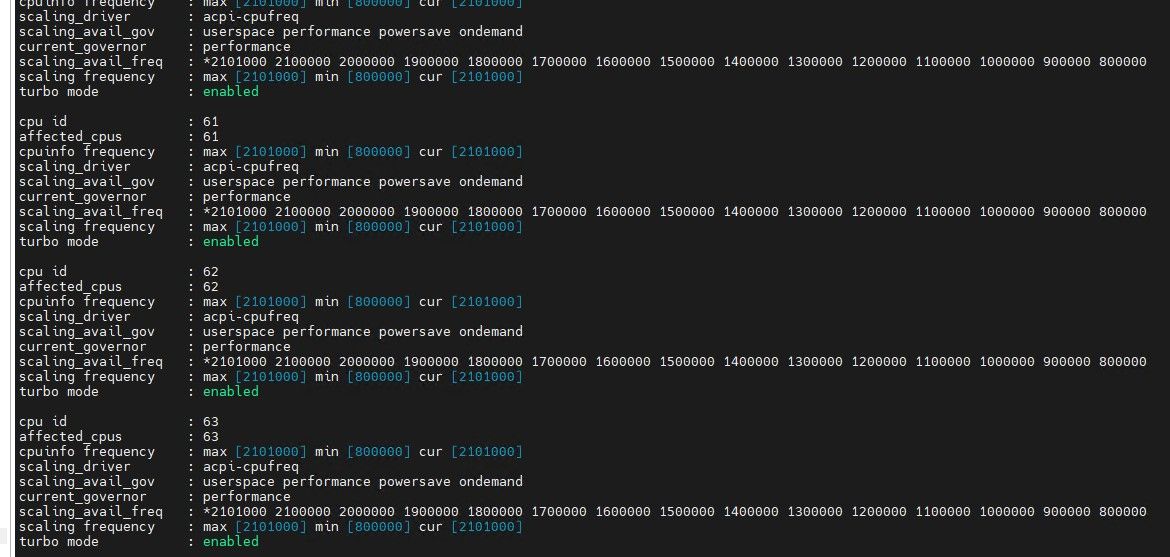
it's an HPE DL380 Gen 11
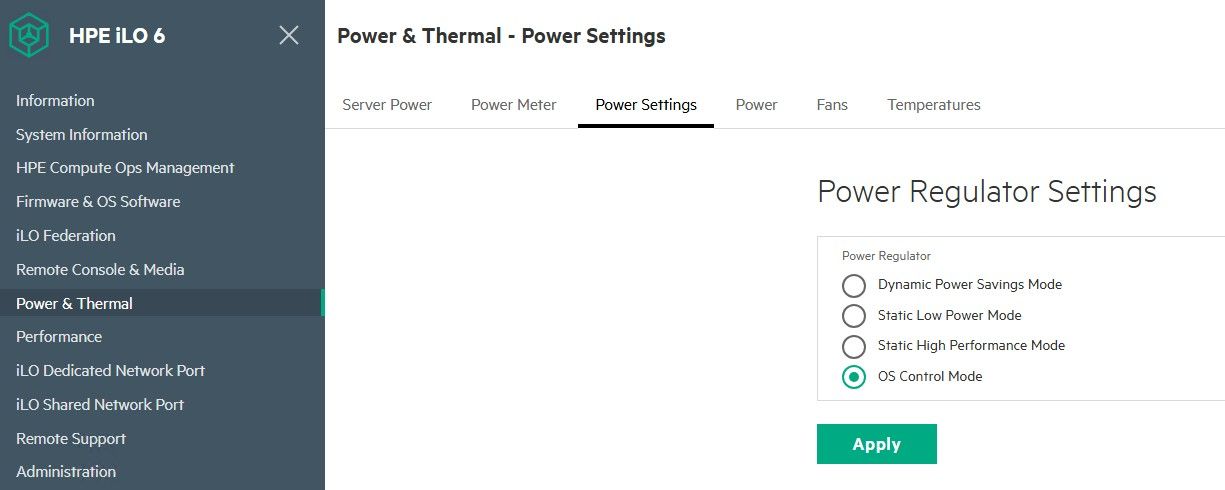
modified in the iLO web ui, but then needed to reboot hostwas previously on DYNAMIC POWER SAVINGS
-
On a Lenovo SR630 V4 it took
Power/Performance Biasset toOS Controlled, and on an HPE DL380 Gen 11 it was the iLO Power Regulator moved off Dynamic Power Savings toOS Control Mode, with a host reboot.
Both then returned real values fromxenpm get-cpufreq-parainstead of the failure line.
@bleader is right that two vendors is not enough to document, so if your host works, could you post the vendor, the exact setting name, where it lives, and whether you needed a reboot? Dell, Supermicro and anything AMD are the obvious gaps.
I don't know whether the firmware is withholding p-state control outright or just not publishing the ACPI objects Xen looks for, so I would rather collect settings than write up a mechanism I can't back.Thanks!

-
 P poddingue marked this topic as a question on


Hello! It looks like you're interested in this conversation, but you don't have an account yet.
Getting fed up of having to scroll through the same posts each visit? When you register for an account, you'll always come back to exactly where you were before, and choose to be notified of new replies (either via email, or push notification). You'll also be able to save bookmarks and upvote posts to show your appreciation to other community members.
With your input, this post could be even better 💗
Register Login