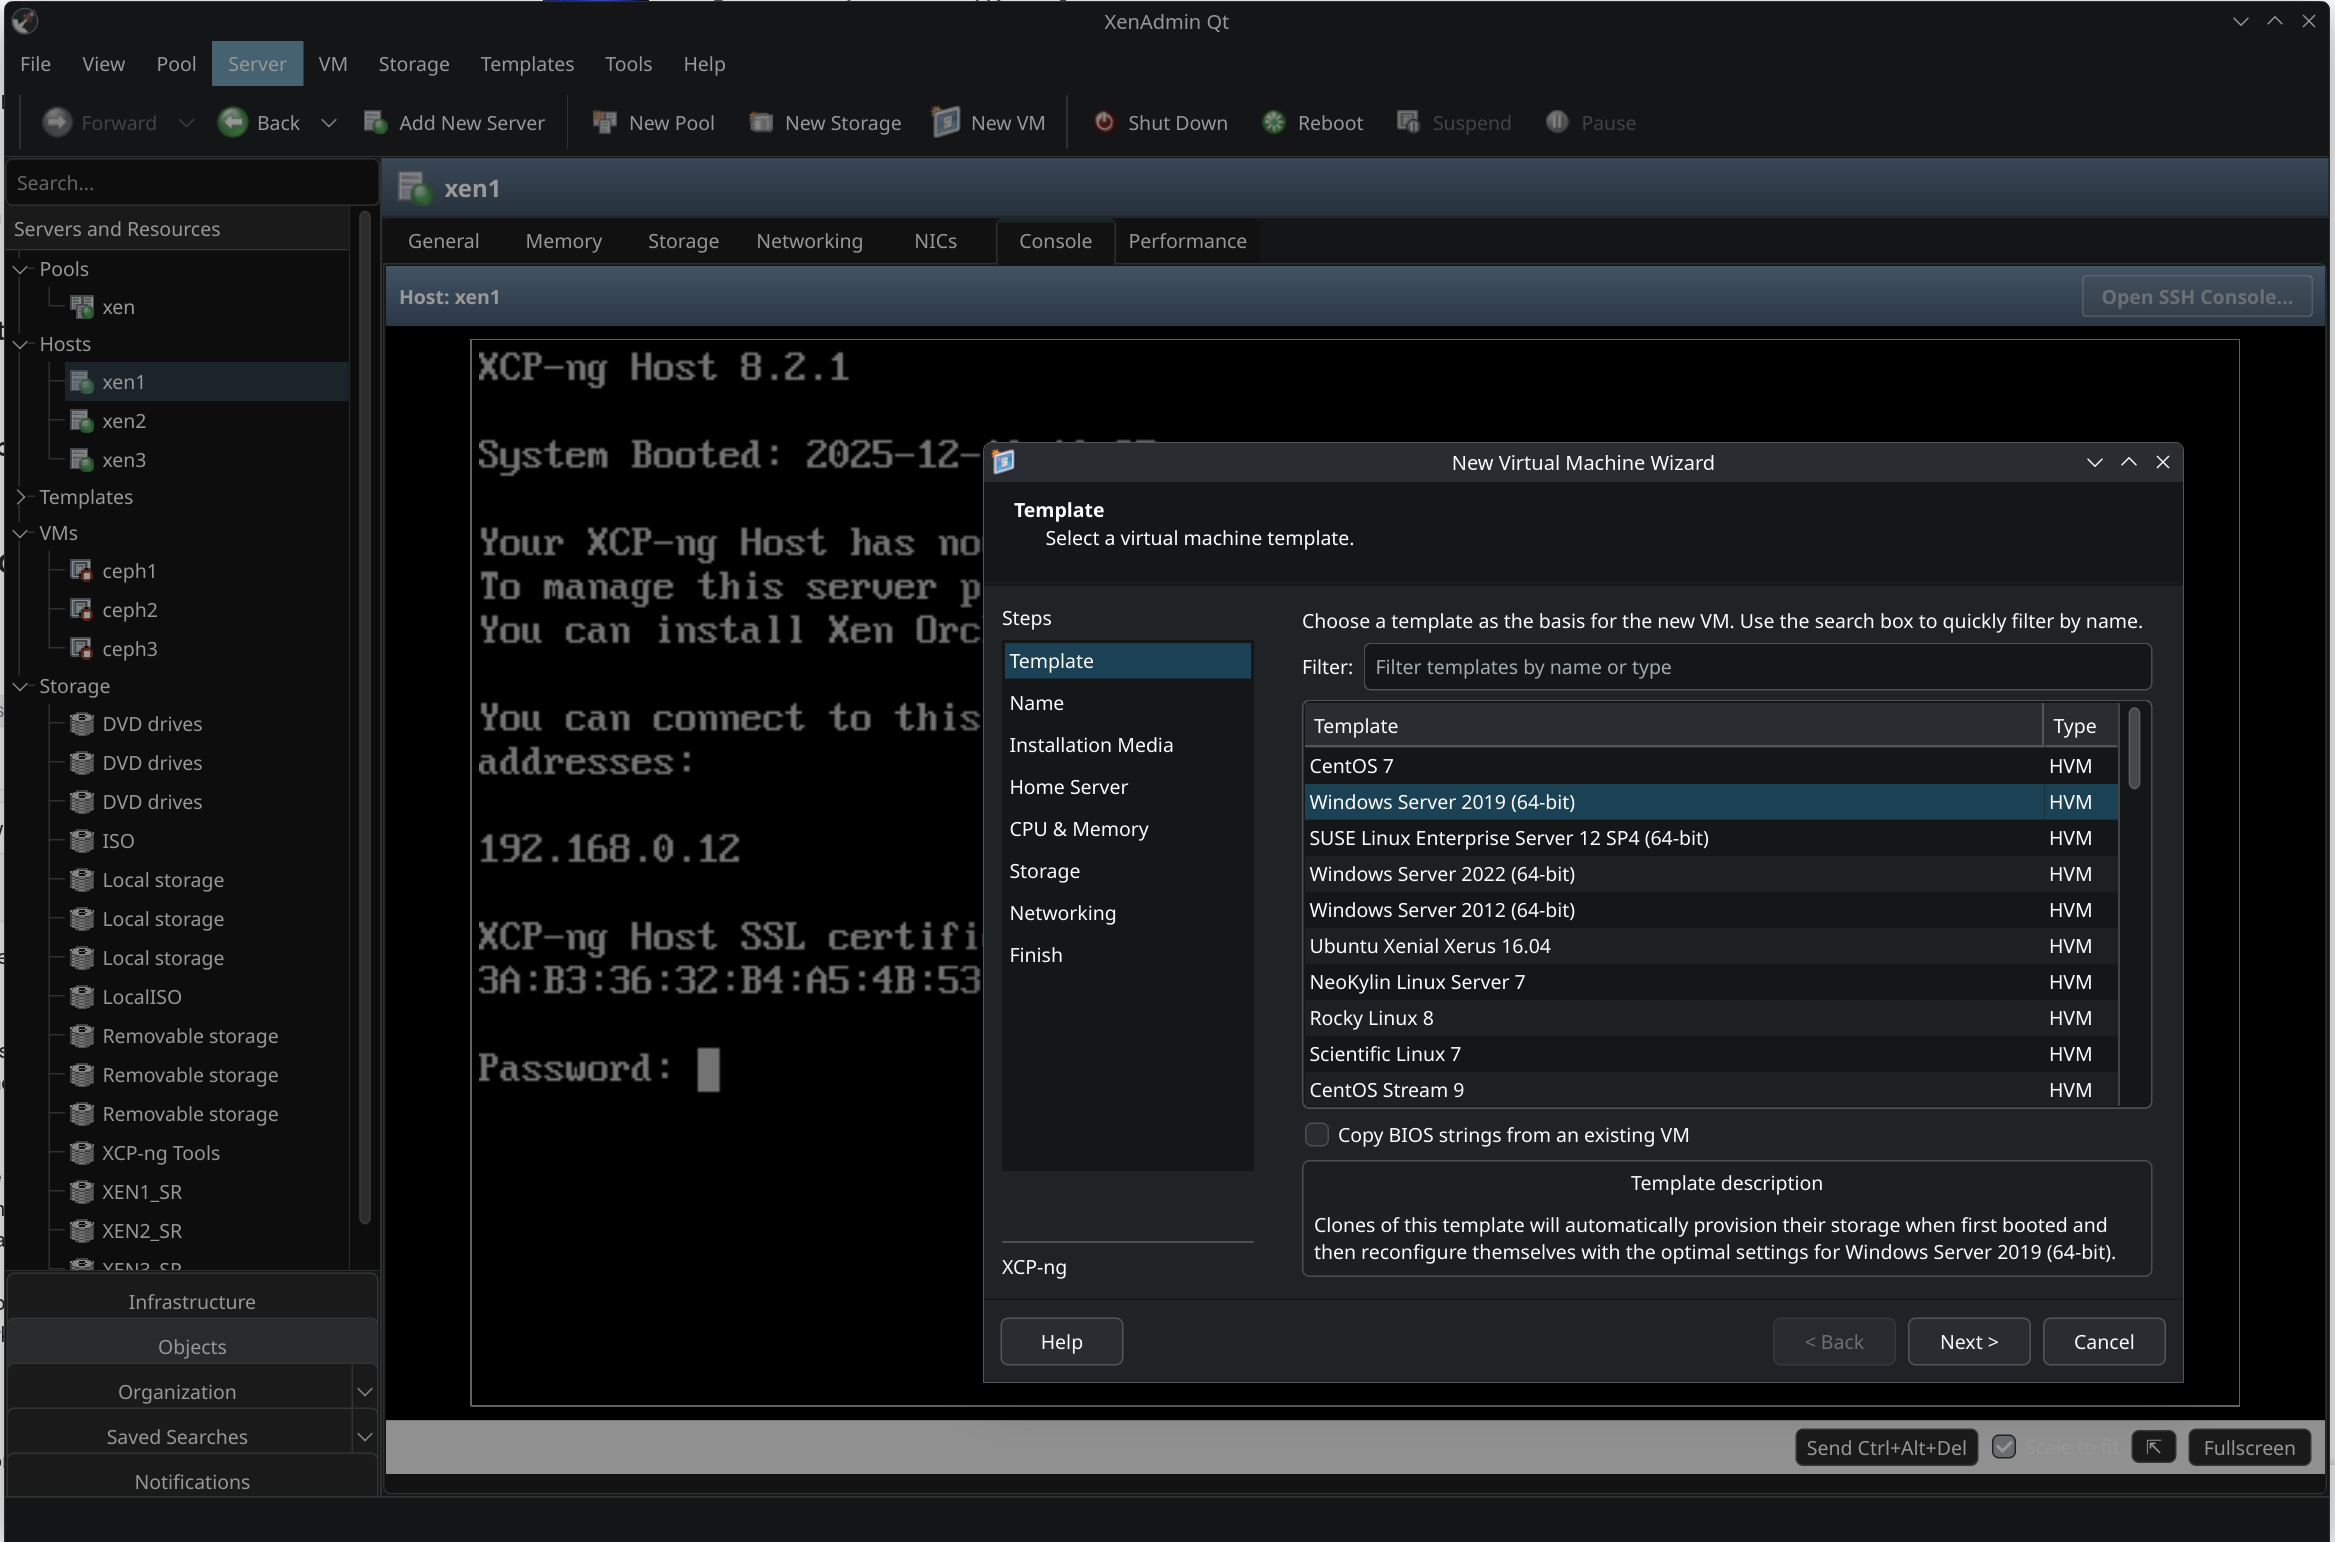
New project - XenAdminQt - a cross-platform GNU/Linux, macOS, Windows native thick client
-
@Tristis-Oris There are many features missing since it's alpha now, but you can open bug tracker request on github if you want to keep track of progress for this particular feature.
-
@benapetr
Consider making a PR to https://github.com/xcp-ng/xcp-ng-org (https://github.com/xcp-ng/xcp-ng-org/blob/master/docs/management/management.md) if you want to make your project more visible. -
@TeddyAstie good idea, thanks, I will do it once I get close to releasing first non-alpha version, right now it's still too immature for production use (although latest master version is so good and stable I already use it to manage most of my own clusters)
-
Note we already gave visibility on this project twice, with the last 2 XO blog post release and newsletter
")
-
@olivierlambert ok that's great, I didn't even notice, thanks!
-
I just released 0.0.4! Still an alpha, but it's becoming pretty usable - there was over 60 commits of code cleanup, polish and also limited testing of all visible features - pretty much everything that is now visible in the UI should be operational at this point, option pages, properties of hosts, pools, VDIs, configuration of NICs, even bonding and advanced stuff like pool password / secret rotation. All XAPI actions and commands were already ported over from C# variant, so my focus now is only on finishing it into a final usable product.
We also have some features that original client doesn't have (such as XenCache explorer)!
Next on my to-do is to add all features that are currently missing completely: HA, GPU, PCIe, VM import / export etc.
Note: I will not be porting over any licensed or proprietary Citrix stuff. This tool may work with XenServer just fine, but I will not be porting over any of the proprietary features, because I will never use it and I have no way to test it either.
-
Version 0.0.5 alpha was just released.
Tree view got major fix - it's now almost fully on-par with the C# version, all logic and missing icons and context menus were fixed.
This is rather a quality of life release, from features only GPU support was added, rest were only bug fixes, but a lot of them. XenAdmin is now so stable now I am even using it on my production servers. It already feels same (even better in some aspects) as the C# version.
I also added some new minor feature - all table views now support export to CSV via context menu (into clipboard), very handy if you need to export data from various views.
-
@benapetr you seem gifted with app development.
do you know RV Tools ? https://www.dell.com/support/kbdoc/en-us/000325532/rvtools-4-7-1-installer
this tool is pretty handy when auditing VMWARE infrastructures, it can connect to vcenter or directly to ESXi and full dump in csv/xlsx the infrastructure configuration (all aspects of the config, be it VM, hosts, networks, datastores, files, ...)
I could see a real production use of same tool, but for XCP Pools/XCP hosts
would be a great add to XenAdmin !
-
@Pilow I know them a little bit, I will have a look, but I am now working on another new cool thing! It's called xen_exporter: https://github.com/benapetr/xen_exporter
It's a prometheus exporter that hooks directly to xen kernel via xenctrl library from dom0 and extract all low-level metrics from the host, allowing very detailed graphs with very low granularity with stuff I always missed in both XenOrchestra and XenAdmin:
Detailed information about the host, every single CPU core utilization, load, avg. load, current frequency, P-state, C-state etc., number of active Xen domains, memory utilization etc. etc. here is example from a host with 80 logical CPUs (older 2 socket ProLiant G9 I have in my lab):
# curl localhost:9120/metrics
# HELP xen_domain_cpu_seconds_total Total domain CPU time in seconds from libxenctrl domain info.
# TYPE xen_domain_cpu_seconds_total counter
xen_domain_cpu_seconds_total{domid="0",uuid="5ac0df60-1089-4c07-8095-42a693bc7150"} 19356.072263010999
# HELP xen_domain_online_vcpus Online vCPUs for domain from libxenctrl.
# TYPE xen_domain_online_vcpus gauge
xen_domain_online_vcpus{domid="0",uuid="5ac0df60-1089-4c07-8095-42a693bc7150"} 16
# HELP xen_domain_runnable_vcpus Runnable vCPUs for domain (online and not blocked), aligned with xcp-rrdd-cpu hostload counting.
# TYPE xen_domain_runnable_vcpus gauge
xen_domain_runnable_vcpus{domid="0",uuid="5ac0df60-1089-4c07-8095-42a693bc7150"} 1
# HELP xen_domain_cpu_usage_ratio Domain CPU usage ratio derived from libxenctrl cpu_time; semantics align with xcp-rrdd-cpu cpu_usage.
# TYPE xen_domain_cpu_usage_ratio gauge
xen_domain_cpu_usage_ratio{domid="0",uuid="5ac0df60-1089-4c07-8095-42a693bc7150"} 0.0094380522656288216
xen_domain_cpu_seconds_total{domid="1",uuid="52c4640b-a257-1db5-e587-233a7c9873d9"} 3418.0258182819998
xen_domain_online_vcpus{domid="1",uuid="52c4640b-a257-1db5-e587-233a7c9873d9"} 4
xen_domain_runnable_vcpus{domid="1",uuid="52c4640b-a257-1db5-e587-233a7c9873d9"} 0
xen_domain_cpu_usage_ratio{domid="1",uuid="52c4640b-a257-1db5-e587-233a7c9873d9"} 0.012024372432675305
# HELP xen_host_cpu_usage_ratio Physical CPU usage ratio per CPU from Xen idletime counters; semantics align with xcp-rrdd-cpu cpuN.
# TYPE xen_host_cpu_usage_ratio gauge
xen_host_cpu_usage_ratio{cpu="0"} 0
xen_host_cpu_usage_ratio{cpu="1"} 0.0055116846393780117
xen_host_cpu_usage_ratio{cpu="2"} 0.0039004025966321576
xen_host_cpu_usage_ratio{cpu="3"} 0
xen_host_cpu_usage_ratio{cpu="4"} 0.0066811401678944504
xen_host_cpu_usage_ratio{cpu="5"} 0
xen_host_cpu_usage_ratio{cpu="6"} 0.0061615590518341312
xen_host_cpu_usage_ratio{cpu="7"} 0
xen_host_cpu_usage_ratio{cpu="8"} 0
xen_host_cpu_usage_ratio{cpu="9"} 0.018294401829196061
xen_host_cpu_usage_ratio{cpu="10"} 0.0097828084505896529
xen_host_cpu_usage_ratio{cpu="11"} 0
xen_host_cpu_usage_ratio{cpu="12"} 0
xen_host_cpu_usage_ratio{cpu="13"} 0.011313510038158392
xen_host_cpu_usage_ratio{cpu="14"} 0
xen_host_cpu_usage_ratio{cpu="15"} 0.0073604364414601164
xen_host_cpu_usage_ratio{cpu="16"} 0.017064714271418868
xen_host_cpu_usage_ratio{cpu="17"} 0
xen_host_cpu_usage_ratio{cpu="18"} 0.019081688214508952
xen_host_cpu_usage_ratio{cpu="19"} 0
xen_host_cpu_usage_ratio{cpu="20"} 0
xen_host_cpu_usage_ratio{cpu="21"} 0.0050337631428650775
xen_host_cpu_usage_ratio{cpu="22"} 0
xen_host_cpu_usage_ratio{cpu="23"} 0.0090213716778614339
xen_host_cpu_usage_ratio{cpu="24"} 0
xen_host_cpu_usage_ratio{cpu="25"} 0.010063162005635951
xen_host_cpu_usage_ratio{cpu="26"} 0.0066331410932402024
xen_host_cpu_usage_ratio{cpu="27"} 0
xen_host_cpu_usage_ratio{cpu="28"} 0.010268124843823001
xen_host_cpu_usage_ratio{cpu="29"} 0
xen_host_cpu_usage_ratio{cpu="30"} 0
xen_host_cpu_usage_ratio{cpu="31"} 0.011560252191338383
xen_host_cpu_usage_ratio{cpu="32"} 0
xen_host_cpu_usage_ratio{cpu="33"} 0.0099933533399266805
xen_host_cpu_usage_ratio{cpu="34"} 0.0094337603182127472
xen_host_cpu_usage_ratio{cpu="35"} 0
xen_host_cpu_usage_ratio{cpu="36"} 0
xen_host_cpu_usage_ratio{cpu="37"} 0
xen_host_cpu_usage_ratio{cpu="38"} 0
xen_host_cpu_usage_ratio{cpu="39"} 0
xen_host_cpu_usage_ratio{cpu="40"} 0
xen_host_cpu_usage_ratio{cpu="41"} 0
xen_host_cpu_usage_ratio{cpu="42"} 0
xen_host_cpu_usage_ratio{cpu="43"} 0
xen_host_cpu_usage_ratio{cpu="44"} 0
xen_host_cpu_usage_ratio{cpu="45"} 0
xen_host_cpu_usage_ratio{cpu="46"} 0
xen_host_cpu_usage_ratio{cpu="47"} 0
xen_host_cpu_usage_ratio{cpu="48"} 0
xen_host_cpu_usage_ratio{cpu="49"} 0
xen_host_cpu_usage_ratio{cpu="50"} 0
xen_host_cpu_usage_ratio{cpu="51"} 0
xen_host_cpu_usage_ratio{cpu="52"} 0
xen_host_cpu_usage_ratio{cpu="53"} 0
xen_host_cpu_usage_ratio{cpu="54"} 0.012625092098940027
xen_host_cpu_usage_ratio{cpu="55"} 0
xen_host_cpu_usage_ratio{cpu="56"} 0.0091633436869092977
xen_host_cpu_usage_ratio{cpu="57"} 0
xen_host_cpu_usage_ratio{cpu="58"} 0
xen_host_cpu_usage_ratio{cpu="59"} 0
xen_host_cpu_usage_ratio{cpu="60"} 0
xen_host_cpu_usage_ratio{cpu="61"} 0
xen_host_cpu_usage_ratio{cpu="62"} 0
xen_host_cpu_usage_ratio{cpu="63"} 0
xen_host_cpu_usage_ratio{cpu="64"} 0
xen_host_cpu_usage_ratio{cpu="65"} 0
xen_host_cpu_usage_ratio{cpu="66"} 0
xen_host_cpu_usage_ratio{cpu="67"} 0
xen_host_cpu_usage_ratio{cpu="68"} 0
xen_host_cpu_usage_ratio{cpu="69"} 0
xen_host_cpu_usage_ratio{cpu="70"} 0
xen_host_cpu_usage_ratio{cpu="71"} 0
xen_host_cpu_usage_ratio{cpu="72"} 0
xen_host_cpu_usage_ratio{cpu="73"} 0
xen_host_cpu_usage_ratio{cpu="74"} 0
xen_host_cpu_usage_ratio{cpu="75"} 0
xen_host_cpu_usage_ratio{cpu="76"} 0
xen_host_cpu_usage_ratio{cpu="77"} 0
xen_host_cpu_usage_ratio{cpu="78"} 0
xen_host_cpu_usage_ratio{cpu="79"} 0
# HELP xen_host_cpu_avg_usage_ratio Average physical CPU usage ratio from Xen idletime counters; semantics align with xcp-rrdd-cpu cpu_avg.
# TYPE xen_host_cpu_avg_usage_ratio gauge
xen_host_cpu_avg_usage_ratio 0.0024868463762477951
# HELP xen_host_cpu_avg_frequency_mhz Average physical CPU frequency in MHz from Xen power-management stats.
# TYPE xen_host_cpu_avg_frequency_mhz gauge
xen_host_cpu_avg_frequency_mhz{cpu="0"} 2090950
xen_host_cpu_avg_frequency_mhz{cpu="1"} 2377080
xen_host_cpu_avg_frequency_mhz{cpu="2"} 2267030
xen_host_cpu_avg_frequency_mhz{cpu="3"} 2156980
xen_host_cpu_avg_frequency_mhz{cpu="4"} 2399090
xen_host_cpu_avg_frequency_mhz{cpu="5"} 2156980
xen_host_cpu_avg_frequency_mhz{cpu="6"} 2377080
xen_host_cpu_avg_frequency_mhz{cpu="7"} 2156980
xen_host_cpu_avg_frequency_mhz{cpu="8"} 2112960
xen_host_cpu_avg_frequency_mhz{cpu="9"} 2333060
xen_host_cpu_avg_frequency_mhz{cpu="10"} 2377080
xen_host_cpu_avg_frequency_mhz{cpu="11"} 2178990
xen_host_cpu_avg_frequency_mhz{cpu="12"} 2178990
xen_host_cpu_avg_frequency_mhz{cpu="13"} 2971350
xen_host_cpu_avg_frequency_mhz{cpu="14"} 2156980
xen_host_cpu_avg_frequency_mhz{cpu="15"} 2421100
xen_host_cpu_avg_frequency_mhz{cpu="16"} 2971350
xen_host_cpu_avg_frequency_mhz{cpu="17"} 2178990
xen_host_cpu_avg_frequency_mhz{cpu="18"} 2949340
xen_host_cpu_avg_frequency_mhz{cpu="19"} 2156980
xen_host_cpu_avg_frequency_mhz{cpu="20"} 2156980
xen_host_cpu_avg_frequency_mhz{cpu="21"} 2156980
xen_host_cpu_avg_frequency_mhz{cpu="22"} 2156980
xen_host_cpu_avg_frequency_mhz{cpu="23"} 2509140
xen_host_cpu_avg_frequency_mhz{cpu="24"} 2156980
xen_host_cpu_avg_frequency_mhz{cpu="25"} 2156980
xen_host_cpu_avg_frequency_mhz{cpu="26"} 2399090
xen_host_cpu_avg_frequency_mhz{cpu="27"} 2156980
xen_host_cpu_avg_frequency_mhz{cpu="28"} 2443110
xen_host_cpu_avg_frequency_mhz{cpu="29"} 2156980
xen_host_cpu_avg_frequency_mhz{cpu="30"} 2156980
xen_host_cpu_avg_frequency_mhz{cpu="31"} 2112960
xen_host_cpu_avg_frequency_mhz{cpu="32"} 2156980
xen_host_cpu_avg_frequency_mhz{cpu="33"} 2333060
xen_host_cpu_avg_frequency_mhz{cpu="34"} 2355070
xen_host_cpu_avg_frequency_mhz{cpu="35"} 2068940
xen_host_cpu_avg_frequency_mhz{cpu="36"} 2002910
xen_host_cpu_avg_frequency_mhz{cpu="37"} 2024920
xen_host_cpu_avg_frequency_mhz{cpu="38"} 2002910
xen_host_cpu_avg_frequency_mhz{cpu="39"} 2024920
xen_host_cpu_avg_frequency_mhz{cpu="40"} 1892860
xen_host_cpu_avg_frequency_mhz{cpu="41"} 1914870
xen_host_cpu_avg_frequency_mhz{cpu="42"} 1892860
xen_host_cpu_avg_frequency_mhz{cpu="43"} 1914870
xen_host_cpu_avg_frequency_mhz{cpu="44"} 1892860
xen_host_cpu_avg_frequency_mhz{cpu="45"} 1914870
xen_host_cpu_avg_frequency_mhz{cpu="46"} 1980900
xen_host_cpu_avg_frequency_mhz{cpu="47"} 2024920
xen_host_cpu_avg_frequency_mhz{cpu="48"} 2024920
xen_host_cpu_avg_frequency_mhz{cpu="49"} 2046930
xen_host_cpu_avg_frequency_mhz{cpu="50"} 1936880
xen_host_cpu_avg_frequency_mhz{cpu="51"} 1958890
xen_host_cpu_avg_frequency_mhz{cpu="52"} 1936880
xen_host_cpu_avg_frequency_mhz{cpu="53"} 1936880
xen_host_cpu_avg_frequency_mhz{cpu="54"} 2773260
xen_host_cpu_avg_frequency_mhz{cpu="55"} 2024920
xen_host_cpu_avg_frequency_mhz{cpu="56"} 2068940
xen_host_cpu_avg_frequency_mhz{cpu="57"} 1936880
xen_host_cpu_avg_frequency_mhz{cpu="58"} 1892860
xen_host_cpu_avg_frequency_mhz{cpu="59"} 1936880
xen_host_cpu_avg_frequency_mhz{cpu="60"} 1914870
xen_host_cpu_avg_frequency_mhz{cpu="61"} 1936880
xen_host_cpu_avg_frequency_mhz{cpu="62"} 1936880
xen_host_cpu_avg_frequency_mhz{cpu="63"} 1936880
xen_host_cpu_avg_frequency_mhz{cpu="64"} 1936880
xen_host_cpu_avg_frequency_mhz{cpu="65"} 1936880
xen_host_cpu_avg_frequency_mhz{cpu="66"} 1936880
xen_host_cpu_avg_frequency_mhz{cpu="67"} 1958890
xen_host_cpu_avg_frequency_mhz{cpu="68"} 1936880
xen_host_cpu_avg_frequency_mhz{cpu="69"} 1958890
xen_host_cpu_avg_frequency_mhz{cpu="70"} 1936880
xen_host_cpu_avg_frequency_mhz{cpu="71"} 1958890
xen_host_cpu_avg_frequency_mhz{cpu="72"} 1936880
xen_host_cpu_avg_frequency_mhz{cpu="73"} 1958890
xen_host_cpu_avg_frequency_mhz{cpu="74"} 1936880
xen_host_cpu_avg_frequency_mhz{cpu="75"} 1958890
xen_host_cpu_avg_frequency_mhz{cpu="76"} 1958890
xen_host_cpu_avg_frequency_mhz{cpu="77"} 1980900
xen_host_cpu_avg_frequency_mhz{cpu="78"} 1980900
xen_host_cpu_avg_frequency_mhz{cpu="79"} 1980900
# HELP xen_host_cpu_pstate_residency_ratio Proportion of time a physical CPU spent in a P-state from Xen PM residency counters.
# TYPE xen_host_cpu_pstate_residency_ratio gauge
xen_host_cpu_pstate_residency_ratio{cpu="0",state="P0"} 1.0208140011677872e-08
xen_host_cpu_pstate_residency_ratio{cpu="0",state="P1"} 0
xen_host_cpu_pstate_residency_ratio{cpu="0",state="P2"} 0
xen_host_cpu_pstate_residency_ratio{cpu="0",state="P3"} 0
xen_host_cpu_pstate_residency_ratio{cpu="0",state="P4"} 0
xen_host_cpu_pstate_residency_ratio{cpu="0",state="P5"} 0
xen_host_cpu_pstate_residency_ratio{cpu="0",state="P6"} 0
xen_host_cpu_pstate_residency_ratio{cpu="0",state="P7"} 0
xen_host_cpu_pstate_residency_ratio{cpu="0",state="P8"} 0
xen_host_cpu_pstate_residency_ratio{cpu="0",state="P9"} 0
xen_host_cpu_pstate_residency_ratio{cpu="0",state="P10"} 0
xen_host_cpu_pstate_residency_ratio{cpu="0",state="P11"} 0
xen_host_cpu_pstate_residency_ratio{cpu="1",state="P0"} 0.0055227636738445791
xen_host_cpu_pstate_residency_ratio{cpu="1",state="P1"} 0
xen_host_cpu_pstate_residency_ratio{cpu="1",state="P2"} 0
xen_host_cpu_pstate_residency_ratio{cpu="1",state="P3"} 0
xen_host_cpu_pstate_residency_ratio{cpu="1",state="P4"} 0
xen_host_cpu_pstate_residency_ratio{cpu="1",state="P5"} 0
xen_host_cpu_pstate_residency_ratio{cpu="1",state="P6"} 0
xen_host_cpu_pstate_residency_ratio{cpu="1",state="P7"} 0
xen_host_cpu_pstate_residency_ratio{cpu="1",state="P8"} 0
xen_host_cpu_pstate_residency_ratio{cpu="1",state="P9"} 0
xen_host_cpu_pstate_residency_ratio{cpu="1",state="P10"} 0
xen_host_cpu_pstate_residency_ratio{cpu="1",state="P11"} 0
xen_host_cpu_pstate_residency_ratio{cpu="2",state="P0"} 0.0039114692212028641
xen_host_cpu_pstate_residency_ratio{cpu="2",state="P1"} 0
xen_host_cpu_pstate_residency_ratio{cpu="2",state="P2"} 0
xen_host_cpu_pstate_residency_ratio{cpu="2",state="P3"} 0
xen_host_cpu_pstate_residency_ratio{cpu="2",state="P4"} 0
xen_host_cpu_pstate_residency_ratio{cpu="2",state="P5"} 0
xen_host_cpu_pstate_residency_ratio{cpu="2",state="P6"} 0
xen_host_cpu_pstate_residency_ratio{cpu="2",state="P7"} 0
xen_host_cpu_pstate_residency_ratio{cpu="2",state="P8"} 0
xen_host_cpu_pstate_residency_ratio{cpu="2",state="P9"} 0
xen_host_cpu_pstate_residency_ratio{cpu="2",state="P10"} 0
xen_host_cpu_pstate_residency_ratio{cpu="2",state="P11"} 0
xen_host_cpu_pstate_residency_ratio{cpu="3",state="P0"} 2.0015960807211515e-09
xen_host_cpu_pstate_residency_ratio{cpu="3",state="P1"} 0
xen_host_cpu_pstate_residency_ratio{cpu="3",state="P2"} 0
xen_host_cpu_pstate_residency_ratio{cpu="3",state="P3"} 0
xen_host_cpu_pstate_residency_ratio{cpu="3",state="P4"} 0
xen_host_cpu_pstate_residency_ratio{cpu="3",state="P5"} 0
xen_host_cpu_pstate_residency_ratio{cpu="3",state="P6"} 0
xen_host_cpu_pstate_residency_ratio{cpu="3",state="P7"} 0

...

0.84987212423135072
xen_host_cpu_cstate_residency_ratio{cpu="27",state="C0"} 0.00015908865793218979
xen_host_cpu_cstate_residency_ratio{cpu="27",state="C1"} 0
xen_host_cpu_cstate_residency_ratio{cpu="27",state="C2"} 0
xen_host_cpu_cstate_residency_ratio{cpu="27",state="C3"} 0
xen_host_cpu_cstate_residency_ratio{cpu="27",state="C4"} 0.99986911723355854
xen_host_cpu_cstate_residency_ratio{cpu="28",state="C0"} 0.013343047999847271
xen_host_cpu_cstate_residency_ratio{cpu="28",state="C1"} 0.0490509266050786
xen_host_cpu_cstate_residency_ratio{cpu="28",state="C2"} 0.00615403285041105
xen_host_cpu_cstate_residency_ratio{cpu="28",state="C3"} 0.029453632044006424

...

0.0012707002614712984
xen_host_cpu_cstate_residency_ratio{cpu="79",state="C3"} 0.0014181654508031323
xen_host_cpu_cstate_residency_ratio{cpu="79",state="C4"} 0.99640523311850959
# HELP xen_host_memory_total_kib Total amount of memory on the Xen host in KiB (xc_physinfo total_pages).
# TYPE xen_host_memory_total_kib gauge
xen_host_memory_total_kib 536737912
# HELP xen_host_memory_free_kib Free memory on the Xen host in KiB (xc_physinfo free_pages).
# TYPE xen_host_memory_free_kib gauge
xen_host_memory_free_kib 518571944
# HELP xen_host_memory_reclaimed_bytes Host memory reclaimed by squeezing in bytes (sum of dynamic-max minus target across domains).
# TYPE xen_host_memory_reclaimed_bytes gauge
xen_host_memory_reclaimed_bytes 0
# HELP xen_host_memory_reclaimed_max_bytes Host memory that could be reclaimed by squeezing in bytes (sum of target minus dynamic-min across domains).
# TYPE xen_host_memory_reclaimed_max_bytes gauge
xen_host_memory_reclaimed_max_bytes 0
# HELP xen_host_running_domains Total number of running domains from libxenctrl domain flags; semantics align with xcp-rrdd-cpu running_domains.
# TYPE xen_host_running_domains gauge
xen_host_running_domains 2
# HELP xen_host_running_vcpus Total running/runnable vCPUs from libxenctrl vcpu info; semantics align with xcp-rrdd-cpu running_vcpus.
# TYPE xen_host_running_vcpus gauge
xen_host_running_vcpus 1
# HELP xen_host_pcpu_count_xen Physical CPU count from libxenctrl xc_physinfo.
# TYPE xen_host_pcpu_count_xen gauge
xen_host_pcpu_count_xen 80
# HELP xen_hostload_ratio Host load per physical CPU from libxenctrl runnable vCPU counting; semantics align with xcp-rrdd-cpu hostload.
# TYPE xen_hostload_ratio gauge
xen_hostload_ratio 0.012500000000000001
# HELP xen_exporter_collector_success Whether a collector update succeeded.
# TYPE xen_exporter_collector_success gauge
xen_exporter_collector_success{collector="xenctrl"} 1
# HELP xen_exporter_collector_duration_seconds Collector update duration in seconds.
# TYPE xen_exporter_collector_duration_seconds gauge
xen_exporter_collector_duration_seconds{collector="xenctrl"} 0.0095337210000000002
# HELP xen_exporter_uptime_seconds Exporter uptime in seconds.
# TYPE xen_exporter_uptime_seconds gauge
xen_exporter_uptime_seconds 180.63357241
This thing with combination of node_exporter allows you to get extremely detailed graphs that perfectly describe CPU, memory, network and IO on lowest level, you can literally see IO queue on individual paths, disk / path latencies, network usage, waits, CPU and RAM utilization.
Minor downside is that this is an extra daemon that needs to be installed on dom0 to expose those diagnostic metrics, but it's written in go (I followed original node_exporter which is also in go) with cgo linking to xenctrl library - it's extremely fast (almost 0 CPU overhead) and uses very little RAM (13MB), but I think it's going to be brilliant tool for low level extremely detailed per-host performance metrics in the future.
Note: There is already a similar project also called xen_exporter, but that one is for me architecturally inacceptable because it's just a wrapper around xapi's rrdd endpoint - same stuff that XenAdmin and Xen Orchestra already uses for its limited graphs, it has to run on 3rd VM (which is probably "cleaner" than running anything on dom0), but needs to connect to xapi using root credentials over HTTPS endpoint and scrape the data from its rrdd endpoint, which is less efficient and much less granular, and probably only works via active master node, so configuring that exporter in prometheus is tricky.
Edit: had to trim that output, too much text for the forum
-
anyway I release most of my personal tools for XCP-ng as open source, so if I ever find a need for anything like rvtools and would start such a project (if nobody else does) I would also publish it as open source.
-
@benapetr said in New project - XenAdminQt - a cross-platform GNU/Linux, macOS, Windows native thick client:
@Pilow I know them a little bit, I will have a look, but I am now working on another new cool thing! It's called xen_exporter: https://github.com/benapetr/xen_exporter
It's a prometheus exporter that hooks directly to xen kernel via xenctrl library from dom0 and extract all low-level metrics from the host, allowing very detailed graphs with very low granularity with stuff I always missed in both XenOrchestra and XenAdmin:
...
We have a similar project : https://github.com/xcp-ng/xcp-metrics, but unfortunately it's not used as of today (though it could get revived as Rust for Xen matures, i.e easier to build).
There is also Xen Orchestra OpenMetrics support but it's not on XCP-ng itself. -
Version 0.0.6 released - it mostly fixes many small things, most notable the console is now very stable, there was a bug in VNC protocol that resulted in randomly getting just a black screen, that was fixed + many other small fixes (unable to add more than 16 disks to VM, host pool join logic, pool creation logic, etc)
There is now also experimental support for override of VM transfer network, following same logic as Xen Orchestra has (it checks if xo_migration_network host otherConfig key is set and if yes it follows it). There is also additional setting for it in pool properties.
https://github.com/benapetr/XenAdminQt/releases/tag/v0.0.6-alpha
-
@benapetr just a small notice, at least in 0.0.5 version. When adding an NFS ISO library SR, there is no choice for NFS version (v3 and v4) like in XCP-ng Center. The XAPI then defaults to v3 which did not work in my environment.
-
@bvitnik good catch, that form had multiple issues, I just fixed all of them - https://github.com/benapetr/XenAdminQt/commit/4847e85f2403f3c6fd328f17754c91df21c36502 this was one of them
-
I haven't found how to set up a physical NIC. you can only edit already configured ones.
-
@Tristis-Oris hello, setup what exactly? you can create bonds from physical NICs, but I don't think original C# client allows anything else either?
-
@benapetr configure dhcp\static mode.
-
@Tristis-Oris that's in management interface configuration, exactly same as in original C# client that had it same
-
@Tristis-Oris maybe a few comparative screenshots would help
-
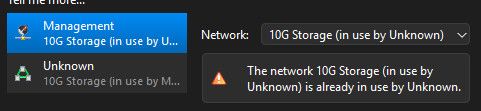
it's only possible to change management interface.
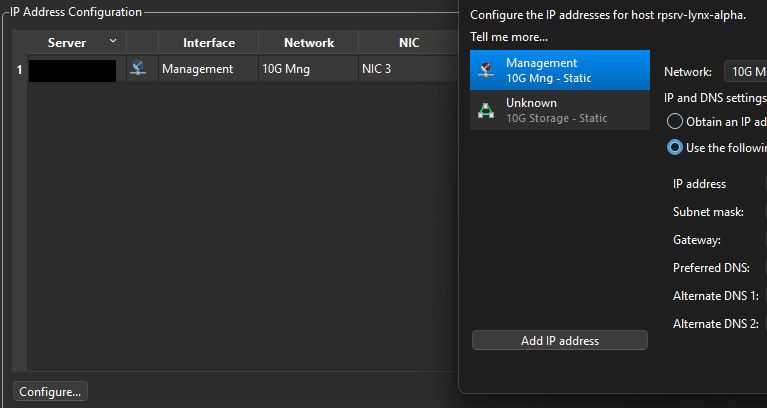
nothing can be done with other NICs.
weird, what is this?
Hello! It looks like you're interested in this conversation, but you don't have an account yet.
Getting fed up of having to scroll through the same posts each visit? When you register for an account, you'll always come back to exactly where you were before, and choose to be notified of new replies (either via email, or push notification). You'll also be able to save bookmarks and upvote posts to show your appreciation to other community members.
With your input, this post could be even better 💗
Register Login